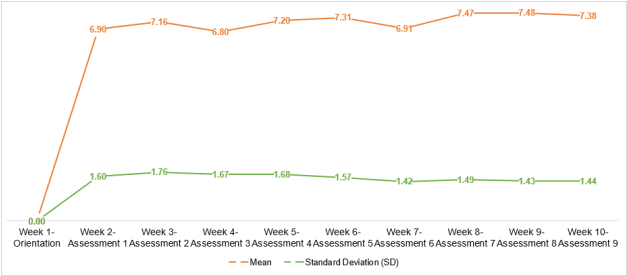
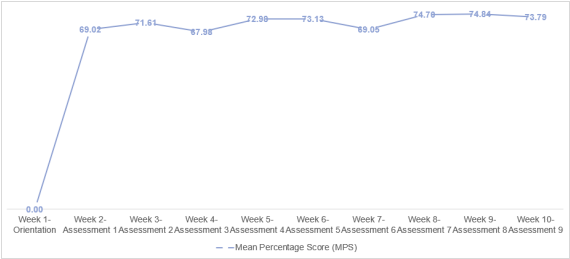
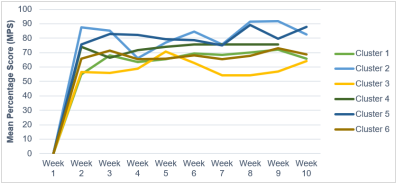
Oral communication performances of PNHS-Main Senior High School students obtained the lowest Mean Percentage Score (MPS) from the performative assessment administered by the Schools Division of Paranaque City. These results were alarming which needed to be intervened. The current study aimed at a two-fold objective, such as providing schools with accurate, data-driven insights into teaching practices through ongoing assessments and instructional monitoring; and improving classroom outcomes by linking assessment findings directly to instructional adjustments. The study employed a mixed-method research design which means to say that collected quantitative data will be supported with qualitative data. Applying this design would help the researchers find out a holistic approach to identify the effectiveness of contextualized assessments. Further, the investigation included 30 class sections comprised of 6 clusters, particularly involving 1,112 Grade 11 students as research participants. In particular, the said research participants came from four senior high school strands, namely: STEM, HUMMS, ABM, and TVL. Furthermore, the teacher-researchers were asked to develop ten assessment tools with 10 multiple-choice test items, aligning these with the Oral Communication in Context Curriculum Guide (CG) and Definitive Budget of Work (DBOW). To ensure the reliability and accuracy of the assessment tools, these were validated by an expert in the field of Language teaching. The teacher-researchers administered a weekly assessment aligned with the targeted competencies for the week with their respective oral communication classes. Moreover, the administration of the weekly assessment lasted for 10 weeks (two quarters or one semester) to be specific. Across 10 weeks the mean scores increased from 6.80 to 7.48, indicating steady improvement associated with weekly formative assessments. To check the assessment results, the data or the test scores were recorded by taking the mean, MPS (Mean Percentage Score), and SD (Standard Deviation) to determine the statistical average and dispersion of the recorded scores. Research findings implied a positive impact, rendering increasing line trends, seemingly proving that the academic interventions employed were effective and appropriately addressed the instructional needs for both teachers and students in Oral Communication in Context. Consequently, the results indicated that formative assessments are needed to assist teachers to adjust their instructions in order to address the needs of the students in the said subject area. Pedagogical implications and recommendations were provided for future research directions.
| Published in | International Journal of Secondary Education (Volume 14, Issue 1) |
| DOI | 10.11648/j.ijsedu.20261401.12 |
| Page(s) | 8-20 |
| Creative Commons |
This is an Open Access article, distributed under the terms of the Creative Commons Attribution 4.0 International License (http://creativecommons.org/licenses/by/4.0/), which permits unrestricted use, distribution and reproduction in any medium or format, provided the original work is properly cited. |
| Copyright |
Copyright © The Author(s), 2026. Published by Science Publishing Group |
Needs-based Approach, Project MAIN, Oral Communication, Needs-driven Instruction, Proficiency
Number of Items | Highest Score | Lowest Score | Mean | MPS | SD | |
|---|---|---|---|---|---|---|
Cluster 1 | 10 | 10 | 4 | 5.48 | 54.85 | 1.68 |
Cluster 2 | 10 | 10 | 5 | 8.75 | 87.52 | 1.08 |
Cluster 3 | 10 | 9 | 2 | 5.64 | 56.40 | 1.80 |
Cluster 4 | 10 | 10 | 3 | 7.40 | 74.01 | 1.82 |
Cluster 5 | 10 | 10 | 5 | 7.57 | 75.68 | 1.47 |
Cluster 6 | 10 | 10 | 0 | 6.56 | 65.63 | 1.78 |
Average | 10 | 10 | 3 | 6.90 | 69.02 | 1.60 |
Number of Items | Highest Score | Lowest Score | Mean | MPS | SD | |
|---|---|---|---|---|---|---|
Cluster 1 | 10 | 10 | 3 | 6.81 | 68.06 | 1.90 |
Cluster 2 | 10 | 10 | 4 | 8.52 | 85.24 | 1.45 |
Cluster 3 | 10 | 10 | 1 | 5.60 | 56.00 | 2.05 |
Cluster 4 | 10 | 10 | 0 | 6.63 | 66.28 | 1.80 |
Cluster 5 | 10 | 10 | 4 | 8.28 | 82.82 | 1.53 |
Cluster 6 | 10 | 10 | 4 | 7.13 | 71.27 | 1.84 |
Average | 10 | 10 | 3 | 7.16 | 71.61 | 1.76 |
Number of Items | Highest Score | Lowest Score | Mean | MPS | SD | |
|---|---|---|---|---|---|---|
Cluster 1 | 10 | 10 | 3 | 6.35 | 63.54 | 1.87 |
Cluster 2 | 10 | 10 | 4 | 6.60 | 66.01 | 1.56 |
Cluster 3 | 10 | 9 | 3 | 5.90 | 58.97 | 1.60 |
Cluster 4 | 10 | 10 | 4 | 7.17 | 71.70 | 1.78 |
Cluster 5 | 10 | 10 | 4 | 8.22 | 82.23 | 1.44 |
Cluster 6 | 10 | 10 | 4 | 6.54 | 65.40 | 1.74 |
Average | 10 | 10 | 4 | 6.80 | 67.98 | 1.67 |
Number of Items | Highest Score | Lowest Score | Mean | MPS | SD | |
|---|---|---|---|---|---|---|
Cluster 1 | 10 | 10 | 3 | 6.55 | 65.53 | 1.78 |
Cluster 2 | 10 | 10 | 4 | 7.68 | 76.85 | 1.78 |
Cluster 3 | 10 | 10 | 4 | 7.06 | 70.62 | 1.57 |
Cluster 4 | 10 | 10 | 3 | 7.40 | 74.04 | 1.61 |
Cluster 5 | 10 | 10 | 5 | 7.91 | 79.13 | 1.37 |
Cluster 6 | 10 | 10 | 3 | 6.57 | 65.72 | 1.96 |
Average | 10 | 10 | 4 | 7.20 | 72.98 | 1.68 |
Number of Items | Highest Score | Lowest Score | Mean | MPS | SD | |
|---|---|---|---|---|---|---|
Cluster 1 | 10 | 10 | 3 | 6.93 | 69.30 | 1.84 |
Cluster 2 | 10 | 10 | 5 | 8.45 | 84.47 | 1.43 |
Cluster 3 | 10 | 10 | 4 | 6.27 | 62.68 | 1.76 |
Cluster 4 | 10 | 10 | 4 | 7.57 | 75.65 | 1.00 |
Cluster 5 | 10 | 10 | 4 | 7.86 | 78.59 | 1.62 |
Cluster 6 | 10 | 10 | 3 | 6.81 | 68.08 | 1.79 |
Average | 10 | 10 | 4 | 7.31 | 73.13 | 1.57 |
Number of Items | Highest Score | Lowest Score | Mean | MPS | SD | |
|---|---|---|---|---|---|---|
Cluster 1 | 10 | 10 | 3 | 6.85 | 68.47 | 1.63 |
Cluster 2 | 10 | 10 | 5 | 7.56 | 75.58 | 1.42 |
Cluster 3 | 10 | 10 | 4 | 5.44 | 54.41 | 1.52 |
Cluster 4 | 10 | 10 | 4 | 7.56 | 75.62 | 1.01 |
Cluster 5 | 10 | 10 | 4 | 7.48 | 74.83 | 1.47 |
Cluster 6 | 10 | 10 | 4 | 6.54 | 65.41 | 1.48 |
Average | 10 | 10 | 4 | 6.91 | 69.05 | 1.42 |
Number of Items | Highest Score | Lowest Score | Mean | MPS | SD | |
|---|---|---|---|---|---|---|
Cluster 1 | 10 | 10 | 3 | 6.99 | 69.93 | 1.54 |
Cluster 2 | 10 | 10 | 3 | 9.15 | 91.48 | 1.51 |
Cluster 3 | 10 | 10 | 4 | 5.42 | 54.24 | 1.22 |
Cluster 4 | 10 | 10 | 4 | 7.58 | 75.78 | 1.65 |
Cluster 5 | 10 | 10 | 4 | 8.91 | 89.08 | 1.26 |
Cluster 6 | 10 | 10 | 4 | 6.77 | 67.69 | 1.75 |
Average | 10 | 10 | 4 | 7.47 | 74.70 | 1.49 |
Number of Items | Highest Score | Lowest Score | Mean | MPS | SD | |
|---|---|---|---|---|---|---|
Cluster 1 | 10 | 10 | 3 | 7.21 | 72.06 | 1.25 |
Cluster 2 | 10 | 10 | 5 | 9.17 | 91.68 | 1.13 |
Cluster 3 | 10 | 10 | 4 | 5.69 | 56.92 | 1.53 |
Cluster 4 | 10 | 10 | 4 | 7.57 | 75.68 | 1.74 |
Cluster 5 | 10 | 10 | 4 | 7.96 | 79.60 | 1.42 |
Cluster 6 | 10 | 10 | 4 | 7.31 | 73.10 | 1.48 |
Average | 10 | 10 | 4 | 7.48 | 74.84 | 1.43 |
Number of Items | Highest Score | Lowest Score | Mean | MPS | SD | |
|---|---|---|---|---|---|---|
Cluster 1 | 10 | 10 | 3 | 6.57 | 65.65 | 1.44 |
Cluster 2 | 10 | 10 | 5 | 8.27 | 82.70 | 1.50 |
Cluster 3 | 10 | 10 | 4 | 6.42 | 64.20 | 1.69 |
Cluster 4 | - | - | - | - | - | - |
Cluster 5 | 10 | 10 | 4 | 8.77 | 87.74 | 1.18 |
Cluster 6 | 10 | 10 | 4 | 6.86 | 68.64 | 1.40 |
Average | 10 | 10 | 4 | 7.38 | 73.79 | 1.44 |
MPS | DESCRIPTIVE EQUIVALENT |
|---|---|
90 – 100 | Highly Proficient |
75 – 89 | Proficient |
50 -74 | Nearly Proficient |
25 – 49 | Low Proficient |
0 - 24 | Not Proficient |
MPS | DESCRIPTIVE EQUIVALENT |
|---|---|
96 – 100 | Mastered |
86 – 95 | Closely Approximating Mastery |
66 – 85 | Moving Towards Mastery |
35 – 65 | Average Mastery |
15 – 34 | Low Mastery |
5 – 14 | Very Low Mastery |
0 - 4 | Absolutely No Mastery |
| [1] | Abu-Arquob, I. & Alserhan, F.(2019). Non-verbal barriers to effective intercultural communication. Corpus ID 238333505. |
| [2] | Ahmed, S. (2023). From Communicative Competence to Communication Proficiency: A Theoretical Study. |
| [3] | Apat, H. et al (2023). The influence of oral communication on the learning engagement of students. (2023). Canadian Journal of Language and Literature Studies, 3(4). |
| [4] | Banga, C. & Suri, J (2015). Role of Language in Human Life. ISSN 2321-7065. |
| [5] | Bayasen, R. (2024). A Systematic Literature Review of Authentic Assessments in English Language Teaching. ISSN: 2583-0406. |
| [6] | Bautista, R. B., & Del Valle, J. (2023). Communicative competence and oral language usage of Filipino learners in English. International Journal of Educational Management and Development Studies, 4(1), 1–24. |
| [7] | Burns, M. K. (n.d.). Effect of cognitive processing assessments and interventions on academic outcomes: Can 200 studies be wrong?. |
| [8] | Canale, M. and Swain, M. 1980. Theoretical bases of communicative approaches to second language teaching and testing. Applied Linguistics 1(1), 1-47. |
| [9] | Crystal, D. (2003). English as a global language. In Cambridge University Press eBooks. |
| [10] | Dicdiquin, J. B., Mobo, F. D., & Cutillas, A. L. (2023). Evaluating the effectiveness of professional development programs for junior high school mathematics teachers in improving mathematics instruction in the K to 12 curriculum in the Philippines. International Journal of Multidisciplinary Applied Business and Education Research, 4(4), 1143–1153. |
| [11] | Dunbar, N. E., Brooks, C. F., & Kubicka-Miller, T. (2016). Oral communication skills in. |
| [12] | Higher education: Using a performance-based evaluation rubric to assess. |
| [13] | communication skills. Innovative Higher Education, 31, 115-128. |
| [14] | Frianeza, E. D., Maravilla, H. D., Relox, R. D., Dagaraga, S. J. S. L., Cruz, C. a. D., Solomon, E. H., & Mohammad, N. K. (2024). Challenges in the Philippine Educational System and its Impact Towards Teachers’ Instruction Strategies and Professional Growth. Journal of Pedagogy and Education Science, 3(01), 63–71. |
| [15] | Gràcia, M., Alvarado, J. M., & Nieva, S. (2021). Assessment of oral skills in adolescents. Children, 8(12), 1136. |
| [16] | Group, D. F., & Group, D. F. (2016). A transdisciplinary framework for SLA in a multilingual world. Modern Language Journal, 100(S1), 19–47. |
| [17] | Guskey, T. R. (2021). Professional development and teacher change. Teachers and Teaching, 27(1), 98- 114. |
| [18] | Halliday, M. (1989). Introduction to functional grammar. Language, 65(4), 862. |
| [19] | Hirsh, Å. (2020). When assessment is a constant companion: students’ experiences of instruction in an era of intensified assessment focus. Nordic Journal of Studies in Educational Policy, 6(2), 89–102. |
| [20] | Houston, L (September 2017). “Working Memory Difficulties: Strategies for the Classroom.” LD@School. |
| [21] | Lagmay, E. A. D., Cruz, E., & Lopez, K. (2022). The impact of extreme weather on student learning in the Philippines. Philippine Journal of Educational Research, 10(3), 112–124. |
| [22] | Langelaan, B. N. (2024). Differentiating instruction: Understanding the key elements for classroom success. Education Today, 18(1), 33–49. |
| [23] | Pesina R, 2025. Mentoring software in education and its impact on teacher development: An integrative literature review. International Journal on Integrating Technology in Education 14(1): 29–38. |
| [24] | Madrunio, M. R., Martin, I. P., & Plata, S. M. (2015). English Language education in the Philippines: policies, problems, and prospects. In Language policy (pp. 245–264). |
| [25] | Marzano, R. J. (2003). What Works in schools: Translating research into action. Alexandria, VA: Association for Supervision and Curriculum Development. |
| [26] | Niculescu, M. (2015). The quality of the educational process via classroom leadership. Procedia - Social and Behavioral Sciences, 180, 885–891. |
| [27] | Nyarko, K., Kugbey, N., Kofi, C. C., Cole, Y. A., & Adentwi, K. I. (2018). English reading proficiency and academic performance among lower primary school children in Ghana. SAGE Open, 8(3). |
| [28] | Swanson, H. L., Arizmendi, G. D., & Li, J. (2021). What mediates the relationship between growth in math problem-solving and working memory in English language learners? Journal of Educational Psychology, 114(7), 1608–1632. |
| [29] | Suson, R., Baratbate, C., Anoos, W., Ermac, E., Aranas, A. G., Malabago, N., Galamiton, N., & Capuyan, D. (2020). Differentiated instruction for basic reading comprehension in Philippine settings. Universal Journal of Educational Research, 8(9), 3814–3824. |
| [30] | Sioco, E. C., & Presley, D. V., V. (n.d.). Grammatical competence of junior high school students. |
| [31] | Timperley, H., & Wilson, A. (2023). Feedback for learning: Building a culture of formative practice. Teaching and Teacher Education, 128, 104079. |
| [32] | Tomlinson, C. A., & Jarvis, J. M. (2023). Differentiated instruction revisited: Evidence and impact in mixed-ability classrooms. Review of Educational Research, 93(2), 215–240. |
| [33] | Vaughn, S., & Fletcher, J. (2021, June 1). Explicit instruction as the essential tool for executing the science of reading. |
| [34] | Victoria, M., Xu, F. H., & Pilcher, N. (2024). English as a Lingua Franca : intercultural interaction in the context of Asian ‘third space.’ Asian Englishes, 27(1), 159–177. |
| [35] | Widayati, A., MacCallum, J., & Woods-McConney, A. (2021). Teachers’ perceptions of continuing professional development: a study of vocational high school teachers in Indonesia. Teacher Development, 25(5), 604–621. |
| [36] | Widyastuti, W. (2017). Authentic material and automaticity for teaching English. Register Journal, 10(1), 83. |
| [37] | Wiliam, D. (2009). Assessment for learning: Why, what and How? UCL Institute of Education Press (University College London Institute of Education Press). |
| [38] | Xuan, Q., Li, L., & Sun, J. (2022). The effectiveness of formative assessment for enhancing learning achievement in secondary schools. Frontiers in Psychology, 13, 926430. |
APA Style
Morales, R. C., Lumaban, G. A., Regodon, Z. N., Ribleza, R. R., Elpides, E. B., et al. (2026). Project Main (Monitoring Assessment of Instructional Needs): Maximizing Oral Communication Proficiency Through Needs–Driven Instruction. International Journal of Secondary Education, 14(1), 8-20. https://doi.org/10.11648/j.ijsedu.20261401.12
ACS Style
Morales, R. C.; Lumaban, G. A.; Regodon, Z. N.; Ribleza, R. R.; Elpides, E. B., et al. Project Main (Monitoring Assessment of Instructional Needs): Maximizing Oral Communication Proficiency Through Needs–Driven Instruction. Int. J. Second. Educ. 2026, 14(1), 8-20. doi: 10.11648/j.ijsedu.20261401.12
AMA Style
Morales RC, Lumaban GA, Regodon ZN, Ribleza RR, Elpides EB, et al. Project Main (Monitoring Assessment of Instructional Needs): Maximizing Oral Communication Proficiency Through Needs–Driven Instruction. Int J Second Educ. 2026;14(1):8-20. doi: 10.11648/j.ijsedu.20261401.12
@article{10.11648/j.ijsedu.20261401.12,
  author = {Rodrigo Concepcion Morales and Gerry Ariate Lumaban and Zenaida Nicomedez Regodon and Richard Rabe Ribleza and Emmanuel Bandibas Elpides and Joy Men Openiano Mendoza and Maria Theresa Corral Ribleza and Eddie Anerdes Rubi Jr. and Kimberly Ann Pigos Ugerio and Ivy Abocado Avis and Lea Jane Gaindo Baldidomar and John Casiano Colona Mayuga and Elmerito Balondo Melindo Jr. and Alejo Jann Corral Paraoan and Shera Mae Martinez Rosagas},
  title = {Project Main (Monitoring Assessment of Instructional Needs): Maximizing Oral Communication Proficiency Through Needs–Driven Instruction},
  journal = {International Journal of Secondary Education},
  volume = {14},
  number = {1},
  pages = {8-20},
  doi = {10.11648/j.ijsedu.20261401.12},
  url = {https://doi.org/10.11648/j.ijsedu.20261401.12},
  eprint = {https://article.sciencepublishinggroup.com/pdf/10.11648.j.ijsedu.20261401.12},
  abstract = {Oral communication performances of PNHS-Main Senior High School students obtained the lowest Mean Percentage Score (MPS) from the performative assessment administered by the Schools Division of Paranaque City. These results were alarming which needed to be intervened. The current study aimed at a two-fold objective, such as providing schools with accurate, data-driven insights into teaching practices through ongoing assessments and instructional monitoring; and improving classroom outcomes by linking assessment findings directly to instructional adjustments. The study employed a mixed-method research design which means to say that collected quantitative data will be supported with qualitative data. Applying this design would help the researchers find out a holistic approach to identify the effectiveness of contextualized assessments. Further, the investigation included 30 class sections comprised of 6 clusters, particularly involving 1,112 Grade 11 students as research participants. In particular, the said research participants came from four senior high school strands, namely: STEM, HUMMS, ABM, and TVL. Furthermore, the teacher-researchers were asked to develop ten assessment tools with 10 multiple-choice test items, aligning these with the Oral Communication in Context Curriculum Guide (CG) and Definitive Budget of Work (DBOW). To ensure the reliability and accuracy of the assessment tools, these were validated by an expert in the field of Language teaching. The teacher-researchers administered a weekly assessment aligned with the targeted competencies for the week with their respective oral communication classes. Moreover, the administration of the weekly assessment lasted for 10 weeks (two quarters or one semester) to be specific. Across 10 weeks the mean scores increased from 6.80 to 7.48, indicating steady improvement associated with weekly formative assessments. To check the assessment results, the data or the test scores were recorded by taking the mean, MPS (Mean Percentage Score), and SD (Standard Deviation) to determine the statistical average and dispersion of the recorded scores. Research findings implied a positive impact, rendering increasing line trends, seemingly proving that the academic interventions employed were effective and appropriately addressed the instructional needs for both teachers and students in Oral Communication in Context. Consequently, the results indicated that formative assessments are needed to assist teachers to adjust their instructions in order to address the needs of the students in the said subject area. Pedagogical implications and recommendations were provided for future research directions.},
 year = {2026}
}
TY  - JOUR
T1  - Project Main (Monitoring Assessment of Instructional Needs): Maximizing Oral Communication Proficiency Through Needs–Driven Instruction
AU  - Rodrigo Concepcion Morales
AU  - Gerry Ariate Lumaban
AU  - Zenaida Nicomedez Regodon
AU  - Richard Rabe Ribleza
AU  - Emmanuel Bandibas Elpides
AU  - Joy Men Openiano Mendoza
AU  - Maria Theresa Corral Ribleza
AU  - Eddie Anerdes Rubi Jr.
AU  - Kimberly Ann Pigos Ugerio
AU  - Ivy Abocado Avis
AU  - Lea Jane Gaindo Baldidomar
AU  - John Casiano Colona Mayuga
AU  - Elmerito Balondo Melindo Jr.
AU  - Alejo Jann Corral Paraoan
AU  - Shera Mae Martinez Rosagas
Y1  - 2026/01/19
PY  - 2026
N1  - https://doi.org/10.11648/j.ijsedu.20261401.12
DO  - 10.11648/j.ijsedu.20261401.12
T2  - International Journal of Secondary Education
JF  - International Journal of Secondary Education
JO  - International Journal of Secondary Education
SP  - 8
EP  - 20
PB  - Science Publishing Group
SN  - 2376-7472
UR  - https://doi.org/10.11648/j.ijsedu.20261401.12
AB  - Oral communication performances of PNHS-Main Senior High School students obtained the lowest Mean Percentage Score (MPS) from the performative assessment administered by the Schools Division of Paranaque City. These results were alarming which needed to be intervened. The current study aimed at a two-fold objective, such as providing schools with accurate, data-driven insights into teaching practices through ongoing assessments and instructional monitoring; and improving classroom outcomes by linking assessment findings directly to instructional adjustments. The study employed a mixed-method research design which means to say that collected quantitative data will be supported with qualitative data. Applying this design would help the researchers find out a holistic approach to identify the effectiveness of contextualized assessments. Further, the investigation included 30 class sections comprised of 6 clusters, particularly involving 1,112 Grade 11 students as research participants. In particular, the said research participants came from four senior high school strands, namely: STEM, HUMMS, ABM, and TVL. Furthermore, the teacher-researchers were asked to develop ten assessment tools with 10 multiple-choice test items, aligning these with the Oral Communication in Context Curriculum Guide (CG) and Definitive Budget of Work (DBOW). To ensure the reliability and accuracy of the assessment tools, these were validated by an expert in the field of Language teaching. The teacher-researchers administered a weekly assessment aligned with the targeted competencies for the week with their respective oral communication classes. Moreover, the administration of the weekly assessment lasted for 10 weeks (two quarters or one semester) to be specific. Across 10 weeks the mean scores increased from 6.80 to 7.48, indicating steady improvement associated with weekly formative assessments. To check the assessment results, the data or the test scores were recorded by taking the mean, MPS (Mean Percentage Score), and SD (Standard Deviation) to determine the statistical average and dispersion of the recorded scores. Research findings implied a positive impact, rendering increasing line trends, seemingly proving that the academic interventions employed were effective and appropriately addressed the instructional needs for both teachers and students in Oral Communication in Context. Consequently, the results indicated that formative assessments are needed to assist teachers to adjust their instructions in order to address the needs of the students in the said subject area. Pedagogical implications and recommendations were provided for future research directions.
VL  - 14
IS  - 1
ER  -
Department of Education, Schools Division of Parañaque City, Parañaque City, the Philippines;Graduate School, the Pontifical and Royal University of Santo Tomas, Manila City, the Philippines;Graduate School, University of Perpetual Help System DALTA, Las Piñas City, the Philippines
Information