Research Article | | Peer-Reviewed

Correlation of CD1a Positive Langerhans Cells and Transforming Growth Factor β in Oral Submucuous Fibrosis - An Immunohistochemical Study

Received: 30 March 2025     Accepted: 9 April 2025     Published: 23 June 2025
Views:       Downloads:
Abstract

Background: Impaired localized epithelial immune system leads to oral cancer. Langerhans Cells (LCs) act as regulators of immune response which are regulated by Transforming Growth Factor β. But their association in a potentially malignant disorder like Oral Submucous Fibrosis (OSF), has not been researched enough. The aim of this paper was to assess the relationship between TGF β and LCs in OSF and whether TGF β can be successfully used as a therapeutic target. Context: TGF β has been a known regulator of immune response through its action on LCs which is proven in some in –vitro studies and also some of the clinical trials targeting TGF β. Aims: The aim of this paper was to assess the relationship between TGF β and LCs in OSF and whether TGF β can be successfully used as a therapeutic target. Methods & Material: Forty OSF and nine normal buccal mucosa were sectioned and subsequently stained immunohistochemically stained anti CD1a and anti (CD105) antibody respectively. Statistical Analysis Used: Student’s-t-test and One way ANOVA was applied. Results: Overall reduction of LCs in the epithelium of OSF than normal mucosa. There was no association seen between the expression of TGFβ and LCs in different stages or grades of OSF or in normal mucosa. Conclusion: Reduced number of LCs in OSF indicates that it does not correlate with the expression of TGF β. Areca itself may have cytotoxic/genotoxic effects on LCs.

Published in International Journal of Clinical Oral and Maxillofacial Surgery (Volume 11, Issue 1)
DOI 10.11648/j.ijcoms.20251101.15
Page(s) 40-52
Creative Commons

This is an Open Access article, distributed under the terms of the Creative Commons Attribution 4.0 International License (http://creativecommons.org/licenses/by/4.0/), which permits unrestricted use, distribution and reproduction in any medium or format, provided the original work is properly cited.

Copyright

Copyright © The Author(s), 2025. Published by Science Publishing Group

Keywords

Oral Submucous Fibrosis, Langerhans cells, CD1a, TGF β, Potentially Malignant

1. Introduction
Oral Submucous Fibrosis (OSF) is a high risk precancerous condition, predominantly affecting south East Asians . Research on pathogenesis of OSF has explained the role of various growth factors and cytokines that are secreted by inflammatory cells during the disease process which promotes fibrosis by inducing proliferation of fibroblasts, upregulating collagen synthesis and down regulating collagenase production. One such key molecule is Transforming Growth Factor β (TGF β) that is a central matrix modulator. The pleiotropic cytokine TGF β 1 has further been implicated as an important regulator of Langerhans Cells (LCs) as it was reported that the epidermis of TGF β 1 null (-/-) mice lacks LCs. Thus hypothetically, targeting TGF β in the treatment of OSF could indirectly lead to reduction in the number of LCs which in turn may be reduce the immune surveillance and be responsible for the transformation of OSF into oral squamous cell carcinoma. The need of the present study was to evaluate the expression of TGF β and to correlate it with the number and distribution of Langerhans cells in OSF. This could provide insight on whether TGF β blocking agents would modulate the biology of Langerhans cells and enhance the risk of malignant transformation of OSF. We wanted to assess the number and distribution of LCs, and the expression of TGFβ in buccal mucosa of OSF and controls. Any association between the two were also looked for.
2. Methods & Material
The study was conducted in the Department of Oral & Maxillofacial Pathology, The Oxford Dental College Bangalore. The group comprised a total of fifty biopsy specimens which included forty paraffin embedded tissue blocks of clinically diagnosed and histopathologically confirmed cases of OSF of buccal mucosa (Group I) retrieved from the archives of The Department of Oral and Maxillofacial Pathology, The Oxford Dental College, Bengaluru and ten normal oral mucosa of patients without any habits (Group II) taken as control group which were retrieved from the archives of Department of Oral & Maxillofacial Pathology, PM Nadagoude Memorial Dental College and Hospital, Bagalkot. Out of the 10 cases of normal mucosa, 9 were from buccal mucosa and one from gingiva.
Paraffin embedded tissue blocks of OSF and normal oral mucosa were sectioned and stained using H & E and the subsequent serial sections of the same were stained immunohistochemically using anti CD1a antibody and anti TGF β1 and TGF β3 receptor antibody (CD105). Placenta and kidney were used as positive control tissues for TGF β which were processed in the same way as other specimens. Negative control slides were similarly stained except that the process of adding primary antibody was replaced with tris buffer. The IHC procedure was carried out as per manufacturer s protocol.
Assessment of LCs:
The following criteria were used to define the cells positive for the CD1a IHC staining:
CD1a staining found localized which appeared brownish in color.
Round/ovoid brown stained cell body which must be visible completely.
At least one dendritic process must be present from the cell surface.(see Figure 1, Figure 2, Figure 3).
Figure 1: Photomicrograph showing CD1a stained Langerhans cells (X400):
The criteria used to define the LCs positive for the IHC staining:
(1) CD1a staining found localized which appeared brownish in color.
(2) Round/ovoid brown stained cell body which must be visible completely.
(3) At least one dendritic process must be present from the cell surface.
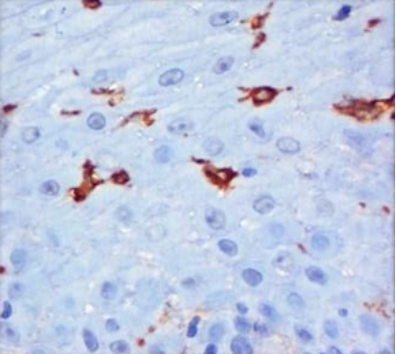
Figure 1. Photomicrograph showing CD1a stained Langerhans cells in (X400).
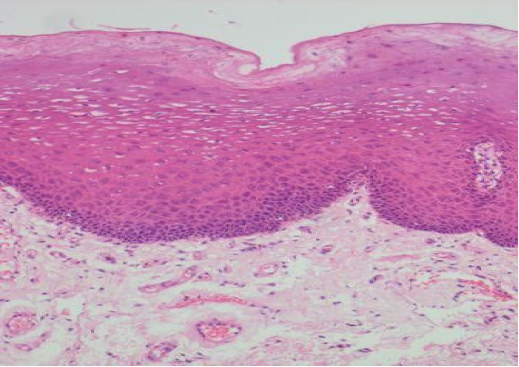
Figure 2. Photomicrograph showing Hematoxylin and Eosin stained normal buccal mucosa in (X100).
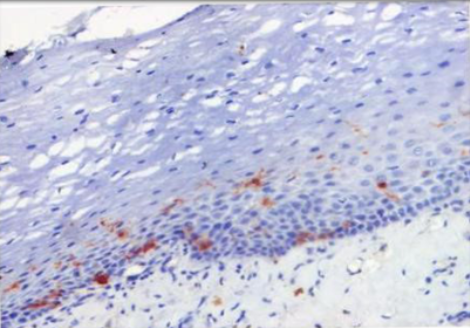
Figure 3. Photomicrograph showing CD1a stained normal buccal mucosa (X200).
Quantitative Analysis of LCs:
In epithelium:
The stained slides of OSF cases were scanned under 4x and 3 hot spots were chosen (nonoverlapping hot spots). Images of these hot spots were captured under higher magnification (40x) using Jenoptik Germany ProgRes C5 cool CCD microphotography camera with Progress Imaging Software. The capture settings were kept same for all the images of the study at 1290x972 pixels and true color images [16 bits RGB] were stored in high quality TIFF format. The total number of cells and cells positive for LCs were counted manually from the images captured.
A labelling index was formed by dividing the total number of positive cells with the total number of cells in the hot spot.
LI = Total number of LCs in each hot spot X 100 / Total number of Cells in each hot spot.
In connective tissue:
Analysis of LCs in the connective tissue were also done. The data were recorded in Microsoft excel sheet for further interpretation and statistical analysis.(see figure 4, figure 5).
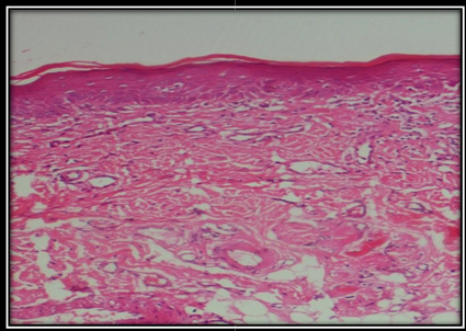
Figure 4. Photomicrograph showing Hematoxylin and Eosin stained OSF (X100).
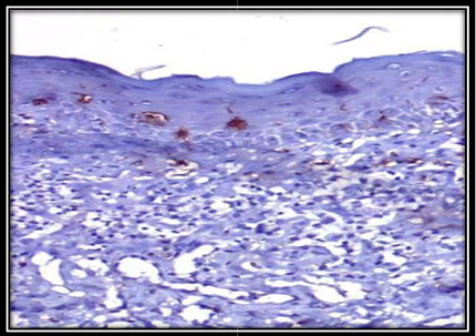
Figure 5. Photomicrograph showing CD1a stained LCs in OSF(X200).
Assessment of TGFβ:
The sections were then viewed under the microscope and assessed for the expression of TGF β. Semi – quantitative analysis of TGF β was done based on the nuclear expression rather than cytoplasmic or membrane staining which has been found in literature. This may be due to the marker CD105 we used which targeted TGF β 1 and TGF β 3 receptors. We analyzed the distribution of expression of TGF β both in the epithelium and connective tissue and the results were classified as mild, moderate, severe, and negative expression.
The semi-quantitative assessment of TGF β were assessed as follows: – negative (no staining); + mild (positive staining less than 1/3 – 33.3% of tissue involved); ++ moderate (positive staining area in between 1/3 – 2/3 – 33.3% - 66.6% of tissue involved) and +++ severe (positive staining for more than 2/3 – more than 66.6% of tissue involved).
The number of LCs was compared between OSF and normal buccal mucosa and also between different stages and grades of OSF. The expression of TGF β in the epithelium and the connective tissue was compared between OSF and normal buccal mucosa and also between different stages and grades of OSF. Finally, any association between number of LCs and expression of TGF β in OSF was evaluated.(see figure 6, figure 7).
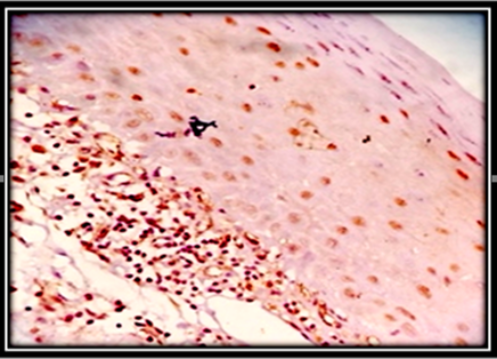
Figure 6. Photomicrograph of OSF showing MILD expression of TGF β (X200).
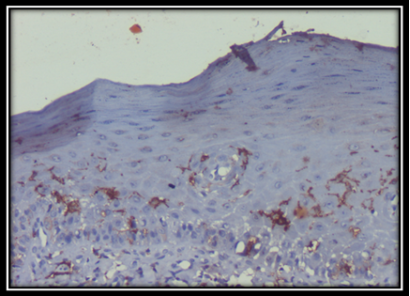
Figure 7. Photomicrograph of OSF showing LCs in cases of MILD TGFβ expression (X200).
Statistical Analysis:
Statistical analysis was done using Student‘s t-test, One Way ANOVA (analysis of variance) and Posthoc Tukey test. A p-value of 0.05 or less was considered statistically significant.
3. Results
Study Design
Our study comprised a total of fifty biopsy specimens which included forty paraffin embedded tissue blocks of clinically diagnosed and histopathologically confirmed cases of OSF from buccal mucosa (Group I) and the control group which included ten paraffin embedded tissue blocks of normal oral mucosa of patients without any habits (Group II). Immunohistochemical analysis was done using CD1a to identify and locate the Langerhans cells followed by TGF β in each of the above mentioned cases. After the hot spots were captured as mentioned in the methodology, the total number of cells and cells positive for LCs were counted manually from the images captured. TGF β expression was looked for both in the epithelium as well as the connective tissue and any correlation was assessed.
Langerhans cells evaluation was done based on the labelling index. With the help of this index, the percentage of LCs were calculated. After which the TGF β evaluation was done on a semi-quantitative level with grades being attributed to the expression- Mild, Moderate, Severe, Negative. Any association between the number of LCs and TGF β expression was analysed. The data obtained were tabulated. Statistical values were analyzed using student t test, One Way ANOVA and Posthoc Tukey test. A p-value of 0.05 or less was considered statistically significant.
In the present study we found that an overall reduction of LCs was found in OSF compared to normal oral mucosa. The expression of TGF β in the epithelium and in the connective tissue of OSF was found to be intense in advanced stages (stage II and stage III) compared to initial stages (stage I). There was no association seen between the expression of TGF β and LCs in OSF or in normal buccal mucosa. Similar findings were seen even when a comparison was made across the stages and grades of OSF. (see figures 8, 9, 10, 11, 12).
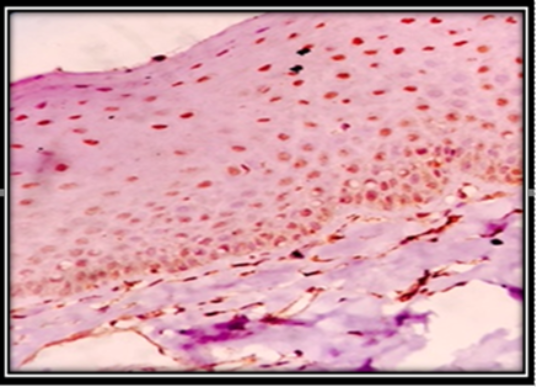
Figure 8. Photomicrograph of OSF showing MODERATE expression of TGFβ (X200).
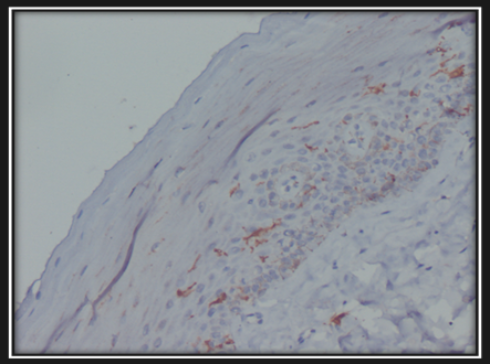
Figure 9. Photomicrograph of OSF showing LCs in cases of MODERATE TGFβ expression (X200):
Figure 10. Photomicrograph of OSF showing SEVERE expression of TGFβ (X200).
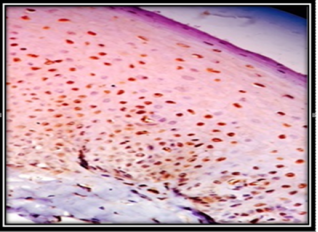
Figure 11. Photomicrograph of OSF showing LCs in cases of SEVERE TGFβ expression (X200).
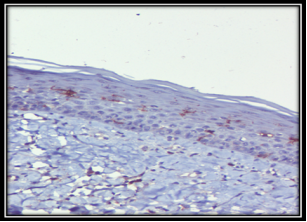
Figure 12. Photomicrograph of normal mucosa showing MILD expression of TGF β (X200):
4. Discussion
Aberrant and persistent tissue inflammation has been considered crucial for the occurrence of tissue fibrosis and cancer. OSF is a potentially malignant disorder wherein areca nut is the main causative factor. It has been considered that induction of oral mucosal inflammation by betel quid ingredients may be a critical event in the pathogenesis of OSF with cytokines like interleukin 6, tumor necrosis factor (TNF), interferon α, etc. and growth factors like TGF-β being synthesized at the site of inflammation. .
Langerhans cells (LCs) are considered to be the sentinels of immune response. These antigen processing cells in the mucosa and in epidermis, have function in initiating an immune response by presenting antigens to lymphocytes which is well documented. Our study has focussed on this immune response by studying the distribution of Langerhans cells in OSF. Our aim was to compare the presence of LCs in OSF with that of normal oral mucosa. We identified CD1a positive LCs both within the epithelium and in the connective tissue of OSF and normal oral mucosa.
Analysis of LCs in the connective tissue were excluded from our study primarily because these were found only in few cases and secondly, they belong to a separate category of dendritic cells. Hence we compared only the Langerhans cells in the epithelium of OSF with that of the normal oral mucosa. In accordance to a previous study by Chiang et al, the present study also showed a significant reduction of LCs in OSF when compared to normal mucosa. (Table 1 and Graph 1).
Table 1. Comparison between the total number of LCs in normal oral mucosa and OSF.

Group

N

Mean

Std. Deviation

t

Df

P VALUE

LCs LABELLING INDEX

OSF

40

6.500608

5.669041

-2.224

20.705

0.037

CONTROL

10

9.802986

3.743874

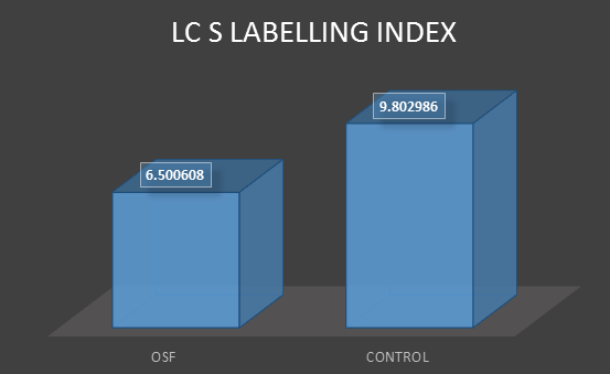
Figure 13. An overall reduction of LCs was found in OSF compared to normal oral mucosa.
(Table 1 & Figure 13 -An overall reduction of LCs was found in OSF compared to normal oral mucosa.)
The reasons for this decrease is not clearly understood but could possibly result from the cytotoxic and genotoxic effects of betel quid components. These substances were found to be toxic to human buccal epithelial cells and cultured oral mucosa fibroblasts. The diminished nutritional supply from the subepithelial connective tissue fibrosis has also been reasoned for shortening the life span of LCs, thereby decreasing the number of LCs in OSF epithelium. A previous report has also indicated that LCs tend to undergo apoptosis when unable to express their immune competent activity which promotes a substantial decrease in the LCs population. .
Another hypothesis from a histological point of view proposed that recruitment of bone marrow derived LCs from the circulation is decreased due to fibrosis and hyalinization of subepithelial connective tissue and subsequent loss of vascularity as the disease progresses from stage I to advanced stage. In our study, however, when the number of LCs were compared among the various stages (table 2) and grades (table 3) of OSF, there was no significant difference observed.Table 2. Comparison of presence of LCs in different stages of OSF.

GROUPS

N

Mean

Std. Deviation

Statistics/ mean squares

df2(welch) / F(Anova)

P VALUE

LCs LABELLING INDEX

STAGE 1

14

7.163871

5.978992

10.474

0.323

0.726

STAGE 2

22

5.653461

5.356824

STAGE 3

3

6.959327

7.066192

Total

39

6.296111

5.591688

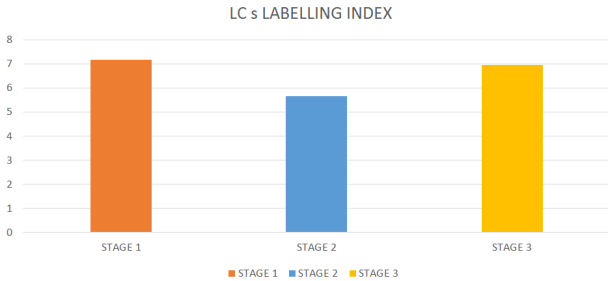
Figure 14. There was no significant difference in the number of LCs in different stages of OSF.
(Table 2 & Figure 14 There was no significant difference in the number of LCs in different stages of OSF.)
Table 3. Comparison of presence of LCs in different stages of OSF.

GROUPS

N

Mean

Std. Deviation

Statistics/ mean squares

df2(welch) / F(Anova)

P VALUE

LCs LABELLING INDEX

GRADE 1

4

6.54749

5.19401

19.908

0.624

0.541

GRADE 2

24

5.547857

5.341275

GRADE 3

11

7.837253

6.412671

Total

39

6.296111

5.591688

Dependent Variable

(I) group

(J) group

Mean Difference (I-J)

Std. Error

P VALUE

LCs LABELLING INDEX

GRADE 1

GRADE 2

0.999633

3.050179

0.943

GRADE 3

-1.28976

3.297624

0.919

GRADE 2

GRADE 3

-2.2894

2.05643

0.512

Transforming growth factor β (TGF β) is known to be a ubiquitous peptide that is expressed by nearly all cell types. There are three TGF-β isoforms in humans—TGF-β1, TGFβ2, and TGF-β3. TGF β1 is expressed in epithelial, hematopoietic, and connective tissue cells, TGF β2 in epithelial and neuronal cells and TGF β3 primarily in mesenchymal cells. As the marker used in our study, Endoglin was TGF-β1 and TGF-β3 receptor associated protein, we found the expression to be widely distributed in epithelial cells, fibroblasts, inflammatory cells and endothelial cells. Similar expression of TGF β has been found in other studies. .
Comparison of TGF β expression in OSF with normal buccal mucosa (Tables 4 and 5) revealed no statistical difference as normal buccal mucosa cases too showed mild, moderate and severe intensity of TGF β expression. Mild to moderate reactivity in normal oral mucosa has also been noticed in other studies. According to literature, CD105 is rarely detected in normal epithelia, with the exception of the glomerular mesangium in human kidneys and melanocytes. But in our study we found normal mucosa expressing CD105 (anti TGF β1and TGFβ 3 receptor).
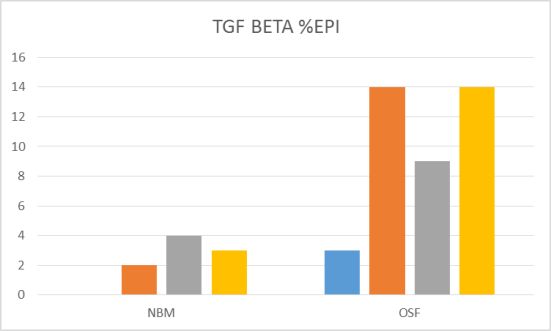
Figure 15. There was no significant difference in the epithelial expression of TGF β between normal buccal mucosa and OSF.
Table 4. Comparison of TGFβ expression in the epithelium of normal buccal mucosa and OSF.

Crosstab

Group

Total

P value

NBM

OSF

TGF-BETA % EPI

NEGATIVE

Count

0

3

3

0.633

% within group

0.0%

7.5%

6.1%

<1/3

Count

2

14

16

% within group

22.2%

35.0%

32.7%

1/3 - 2/3

Count

4

9

13

% within group

44.4%

22.5%

26.5%

>2/3

Count

3

14

17

% within group

33.3%

35.0%

34.7%

Total

Count

9

40

49

% within group

100.0%

100.0%

100.0%

Table 5. Comparison of TGFβ expression in the connective tissue of normal buccal mucosa (NBM)and OSF.

Crosstab

Group

Total

P value

NBM

OSF

TGF BETA % CT

NEGATIVE

Count

0

3

3

0.257

% within group

0.0%

7.5%

6.4%

<1/3

Count

1

15

16

% within group

14.3%

37.5%

34.0%

1/3 - 2/3

Count

4

8

12

% within group

57.1%

20.0%

25.5%

>2/3

Count

2

14

16

% within group

28.6%

35.0%

34.0%

Total

Count

7

40

47

% within group

100.0%

100.0%

100.0%

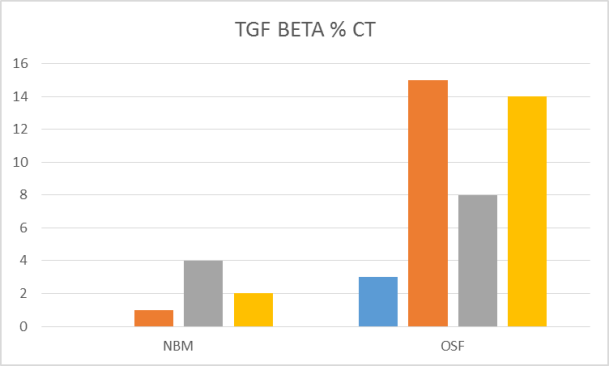
Figure 16. There was no significant difference in the expression of TGF β between connective tissue of normal buccal mucosa and OSF. While higher proportion of cases of normal mucosa showed moderate distribution, higher proportion of cases of OSF showed mild or severe distribution.
(Table 5 & Figure 16: There was no significant difference in the epithelial expression of TGF β between normal buccal mucosa and OSF.) While higher proportion of cases of normal mucosa showed moderate distribution, higher proportion of cases of OSF showed mild or severe distribution.(Table 5 & Figure 17)
We compared the expression of TGF β in epithelium and connective tissue across various stages and grades of OSF. The expression of TGF β in the epithelium and in the connective tissue of OSF was found to be intense in advanced stages (stage II and stage III) compared to initial stages (stage I). (Table 6 and Table 7) We followed Pindborg and Sirsat staging system and so the intense expression of TGF β may be related to increased fibrosis seen as the disease progresses. To the best of our knowledge, none of the studies have compared the expression of TGF β in various stages of OSF.
Table 6. Comparison of TGF β expression in the epithelium in different stages of OSF.

Crosstab

STAGE OF OSF

Total

P VALUE

STAGE 1

STAGE 2

STAGE 3

TGF-BETA % EPI

NEGATIVE

Count

1

2

0

3

0.332

% within STAGE OF OSF

7.1%

9.1%

0.0%

7.7%

<1/3

Count

6

7

1

14

% within STAGE OF OSF

42.9%

31.8%

33.3%

35.9%

1/3 - 2/3

Count

5

3

0

8

% within STAGE OF OSF

35.7%

13.6%

0.0%

20.5%

>2/3

Count

2

10

2

14

% within STAGE OF OSF

14.3%

45.5%

66.7%

35.9%

Total

Count

14

22

3

39

% within STAGE OF OSF

100.0%

100.0%

100.0%

100.0%

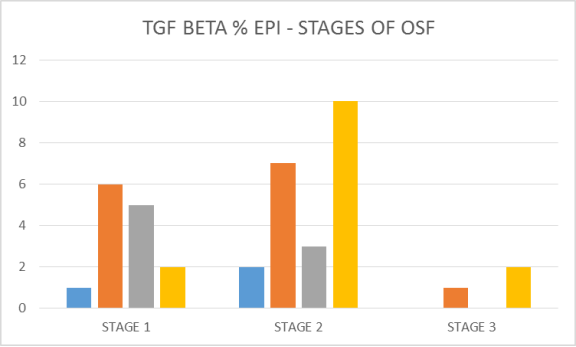
Figure 17. While in initial stage (stage I), higher proportion of cases showed mild expression, with advancing stages of OSF (stage II and stage III), a higher proportion of cases showed severe expression of TGF β in the epithelium.
Table 7. Comparison of TGF β expression in the connective tissue in different stages of OSF.

Crosstab

STAGE OF OSF

Total

P value

STAGE 1

STAGE 2

STAGE 3

TGF BETA % CT

NEGATIVE

Count

1

2

0

3

0.240

% within STAGE OF OSF

7.1%

9.1%

0.0%

7.7%

<1/3

Count

6

8

1

15

% within STAGE OF OSF

42.9%

36.4%

33.3%

38.5%

1/3 - 2/3

Count

5

2

0

7

% within STAGE OF OSF

35.7%

9.1%

0.0%

17.9%

>2/3

Count

2

10

2

14

% within STAGE OF OSF

14.3%

45.5%

66.7%

35.9%

Total

Count

14

22

3

39

% within STAGE OF OSF

100.0%

100.0%

100.0%

100.0%

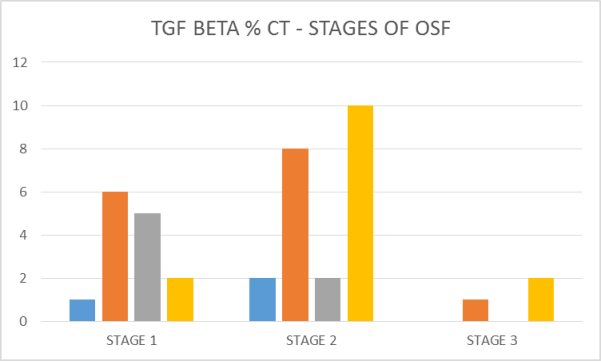
Figure 18. While in initial stage (stage I), higher proportion of cases showed mild expression, with advancing stages of OSF (stage II and stage III), a higher proportion of cases showed severe expression of TGFβ in the connective tissue.
(Table 7 & Figure 18: While in initial stage (stage I), higher proportion of cases showed mild expression, with advancing stages of OSF (stage II and stage III), a higher proportion of cases showed severe expression of TGF β in the epithelium.)
(Table 8 & Figure 19: While in initial stage (stage I), higher proportion of cases showed mild expression, with advancing stages of OSF (stage II and stage III), a higher proportion of cases showed severe expression of TGFβ in the connective tissue.)
When the expression of TGF β in the epithelium and in the connective tissue of OSF was compared across various grades (Tables 8 and 9) also Figures 18 and 19, intense expression was seen in initial (grade I) and in later stages (grade III) compared to grade II. The increased expression in grade I may be related to the increase in inflammatory cells. In grade III, the number of inflammatory cells significantly reduce but still we found intense expression of TGF β. This can lead to the persistence of fibrosis. Presence of other pro-fibrotic mediators may be responsible for this. This is in contrast to other studies where increased expression was seen only in early grades. They ascribed it to chronic inflammatory cell infiltrate which is a common feature in all three histopathological grades but shows a reduced presence in histopathological grade III as a result of the stabilisation of the lesion and reduction in levels of pro-inflammatory mediators.
Table 8. Comparison of TGF β expression in the epithelium in different grades of OSF.

Crosstab

H/P GRADES

Total

P value

GRADE 1

GRADE 2

GRADE 3

TGF-BETA % EPI

NEGATIVE

Count

0

3

0

3

0.152

% within H/P GRADES

0.0%

13.0%

0.0%

7.9%

<1/3

Count

1

11

2

14

% within H/P GRADES

25.0%

47.8%

18.2%

36.8%

1/3 - 2/3

Count

1

5

2

8

% within H/P GRADES

25.0%

21.7%

18.2%

21.1%

>2/3

Count

2

4

7

13

% within H/P GRADES

50.0%

17.4%

63.6%

34.2%

Total

Count

4

24

11

39

% within H/P GRADES

100.0%

100.0%

100.0%

100.0%

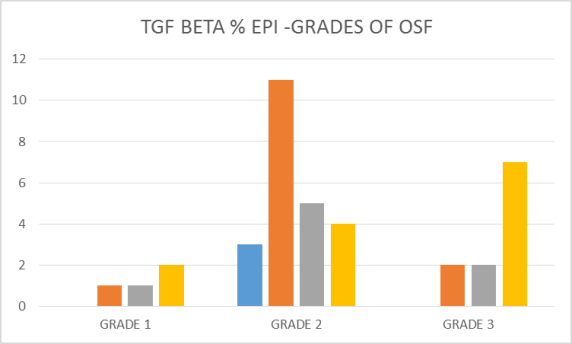
Figure 19. Severe expression of TGF β was seen in epithelium in initial (grade I) and in later stages (grade III) compared to grade II.
Table 9. Comparison of TGF β expression in the connective tissue in different stages of OSF.

Crosstab

H/P GRADES

Total

P value

GRADE 1

GRADE 2

GRADE 3

TGF BETA % CT

NEGATIVE

Count

0

3

0

3

0.118

% within H/P GRADES

0.0%

13.0%

0.0%

7.9%

<1/3

Count

1

12

2

15

% within H/P GRADES

25.0%

52.2%

18.2%

39.5%

1/3 - 2/3

Count

1

4

2

7

% within H/P GRADES

25.0%

17.4%

18.2%

18.4%

>2/3

Count

2

4

7

13

% within H/P GRADES

50.0%

17.4%

63.6%

34.2%

Total

Count

4

24

11

39

% within H/P GRADES

100.0%

100.0%

100.0%

100.0%

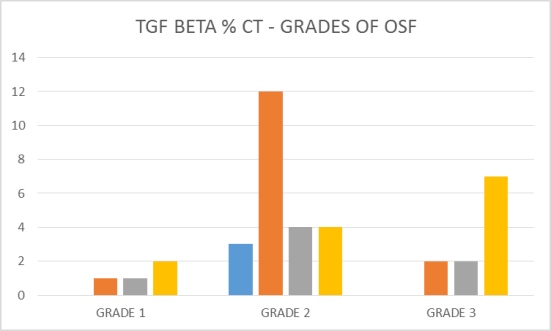
Figure 20. Severe expression of TGF β was seen in connective tissue in initial (grade I) and in later stages (grade III) compared to grade II.
(Table 8 & Figure 19: Severe expression of TGF β was seen in epithelium in initial (grade I) and in later stages (grade III) compared to grade II.)
(Table 9 & Figure 20: Severe expression of TGF β was seen in connective tissue in initial (grade I) and in later stages (grade III) compared to grade II.)
Treatment of oral submucous fibrosis, a fibrotic disorder, is challenging. Currently there are several clinical trials investigating the efficacy of TGF-β blockade in the treatment of various fibrotic diseases. Some of the clinical trials targeting TGF beta have shown depletion in number of LCs. This is in accordance with experimental studies which have proved that TGF β1 is an essential factor in LC development, as the epidermis of TGF β1–deficient mice is devoid of LCs. Any such effect of TGF β on LCs would mean disturbing the immune surveillance in patients with this potentially malignant disorder. So, in this study we wanted to check the correlation between expression of TGF β and number of LCs in OSF.
There was no association seen between the expression of TGF β and LCs in OSF or in normal buccal mucosa. Similar findings were seen even when a comparison was made across the stages and grades of OSF. The reason may be that number of LCs is not solely dependent on TGF β. It could be due to the direct cytotoxic/genotoxic effect of areca nut itself. Our study has only analysed the LCs quantitatively but not qualitatively. Also, TGF β molecule itself is a difficult molecule to study. TGF has numerous and often opposing cellular effects, as a tumor promoter and a tumor suppressor, and as an inhibitor and stimulator of cellular proliferation, apoptosis, and angiogenesis. Thus, a major challenge remains in more precisely defining TGF signalling pathways, including specific pathways involved in mediating the specific and context-dependent effects of TGF. Once these pathways and other potential signaling pathways downstream of TGF are defined, and the contributions of these pathways to the specific cellular and context-dependent effects of TGF- are established, more specific targeting of this pathway will be possible and its effects on LCs, especially on its function, may also be understood better.
5. Conclusion
It is a well-established fact that chewing of betel quid acts as the main culprit in the pathogenesis of OSF thereby leading to a cascade of events starting from immune mediated –T – cell response to production of cytokines and growth factors. There has been no study till date that actually correlates the immunologic mediation and TGF β, a pleiotropic cytokine that is believed to have a pathogenic role. Our study concludes that LCs are not associated with the TGF β expression. A reduction in number of LCs in OSF compared to normal may not be entirely related to distribution of TGF β. It may be due to cytotoxic/genotoxic effects of areca nut use itself.
Abbreviations

OSF

Ral Submucous Fibrosis

DCs

Dendritic Cells

LCs

Langerhans Cells

TGFβ

Transforming Growth Factor Beta

PG

Prostaglandins

BQ

Betel Quid

CD1a

Cluster of Differentiation1a

CD105

Cluster of Differentiation 105 (Anti TGFβ1, TGFβ3)

CD4+

Cluster of Differentiation 4

CD8+

Cluster of Differentiation 8

HPF

High Power Field

IHC

Immunohistochemistry

Conflicts of Interest
The authors declare no conflicts of interest.
References
[1] Arakeri G, Brennan PA. Oral submucous fibrosis: an overview of the etiology, pathogenesis, classification, and principles of management Br J Oral Maxillofac Surg 2013 Oct; 51(7): 587-93.
[2] Kale AD, Mane DR, Shukla D. Expression of transforming growth factor beta and its correlation with lipodystrophy in oral submucous fibrosis: an immunohistochemical study. Med Oral Patol Oral Cir Bucal 2013 Jan; 18(1): e12-18.
[3] Borkowski TA, Letterio JJ, Mackall CL, Saitoh A, Wang XJ, Roop DR. A role for TGFβ1 in langerhans cell biology. Further characterization of the epidermal langerhans cell defect in TGFβ1 Null Mice. J of Clin Invest 1997; 100(3): 575–581.
[4] Rajalalitha P, Vali S. Molecular pathogenesis of oral submucous fibrosis – a collagen metabolic disorder. J Oral Pathol Med 2005; 34: 321–8.
[5] Upadhyay J, Upadhyay RB, Agrawal P, Jaitley S, Shekhar R. Langerhans cells and their role in oral mucosal diseases. N Am J Med Sci 2013; 5: 505–14.
[6] Jaitley S, Gopu S, Rajasekharan ST, Sivapathasundaram B. Immunohistochemical analysis of Langerhans cells in chronic gingivitis using anti-CD1a antibody. Dent Res J 2014; 11(2): 173-9.
[7] Chiang CP, Wu HY, Liu BY, Wang JT, Kuo MY. Quantitative analysis of immunocompetent cells in oral submucous fibrosis in Taiwan. Oral Oncol 2002; 38(1): 56-63.
[8] Sundqvist K, Liu Y, Nair J, Bartsch H, Arvidson K, Grafström RC. Cytotoxic and genotoxic effects of areca nut-related compounds in cultured human buccal epithelial cells. Can Res 1989; 40(19): 5294-98.
[9] Jeng JH, Kuo ML, Hahn LJ, Kuo MY. Genotoxic and non-genotoxic effects of betel quid ingredients on oral mucosal fibroblasts in vitro. J Dent Res 1994; 73(5): 1043-49.
[10] Lasisi TJ, Oluwasola AO, Lasisi OA, Akang EE. Association between langerhans cells population and histological grade of oral squamous cell carcinoma. J Oral Maxillofac Pathol 2013; 17: 329-33.
[11] Prime SS, Pring M, Davies M, Paterson IC. TGF-beta signal transduction in oro-facial health and non-malignant disease (part I). Crit Rev Oral Biol Med 2004; 15: 324-36.
[12] Li C, Issa R, Kumar P, Hampson IN, Lopez-Novoa JM, Bernabeu C, Kumar S. CD105 prevents apoptosis in hypoxic endothelial cells. J Cell Sci 2003 Jul; 116(1): 2677–2685.
[13] Kamath VV, Krishnamurthy S, Satelur KP, Rajkumar K. Transforming growth factor-β1 and TGF-β2 act synergistically in the fibrotic pathway in oral submucous fibrosis: An immunohistochemical observation. Indian J Med Paediatr Oncol 2015; 36: 111-6.
[14] Wrzesinski SH, Wan YY, Flavell RA. Transforming growth factor-beta and the immune response: implications for anticancer therapy. Clin Cancer Res 2007 Sep15: 5262-70.
Cite This Article
  • APA Style

    Elangovan, E., E, E. (2025). Correlation of CD1a Positive Langerhans Cells and Transforming Growth Factor β in Oral Submucuous Fibrosis - An Immunohistochemical Study. International Journal of Clinical Oral and Maxillofacial Surgery, 11(1), 40-52. https://doi.org/10.11648/j.ijcoms.20251101.15

    Copy | Download

    ACS Style

    Elangovan, E.; E, E. Correlation of CD1a Positive Langerhans Cells and Transforming Growth Factor β in Oral Submucuous Fibrosis - An Immunohistochemical Study. Int. J. Clin. Oral Maxillofac. Surg. 2025, 11(1), 40-52. doi: 10.11648/j.ijcoms.20251101.15

    Copy | Download

    AMA Style

    Elangovan E, E E. Correlation of CD1a Positive Langerhans Cells and Transforming Growth Factor β in Oral Submucuous Fibrosis - An Immunohistochemical Study. Int J Clin Oral Maxillofac Surg. 2025;11(1):40-52. doi: 10.11648/j.ijcoms.20251101.15

    Copy | Download

  • @article{10.11648/j.ijcoms.20251101.15,
      author = {Elampavai Elangovan and Elanangai E},
      title = {Correlation of CD1a Positive Langerhans Cells and Transforming Growth Factor β in Oral Submucuous Fibrosis - An Immunohistochemical Study
    },
      journal = {International Journal of Clinical Oral and Maxillofacial Surgery},
      volume = {11},
      number = {1},
      pages = {40-52},
      doi = {10.11648/j.ijcoms.20251101.15},
      url = {https://doi.org/10.11648/j.ijcoms.20251101.15},
      eprint = {https://article.sciencepublishinggroup.com/pdf/10.11648.j.ijcoms.20251101.15},
      abstract = {Background: Impaired localized epithelial immune system leads to oral cancer. Langerhans Cells (LCs) act as regulators of immune response which are regulated by Transforming Growth Factor β. But their association in a potentially malignant disorder like Oral Submucous Fibrosis (OSF), has not been researched enough. The aim of this paper was to assess the relationship between TGF β and LCs in OSF and whether TGF β can be successfully used as a therapeutic target. Context: TGF β has been a known regulator of immune response through its action on LCs which is proven in some in –vitro studies and also some of the clinical trials targeting TGF β. Aims: The aim of this paper was to assess the relationship between TGF β and LCs in OSF and whether TGF β can be successfully used as a therapeutic target. Methods & Material: Forty OSF and nine normal buccal mucosa were sectioned and subsequently stained immunohistochemically stained anti CD1a and anti (CD105) antibody respectively. Statistical Analysis Used: Student’s-t-test and One way ANOVA was applied. Results: Overall reduction of LCs in the epithelium of OSF than normal mucosa. There was no association seen between the expression of TGFβ and LCs in different stages or grades of OSF or in normal mucosa. Conclusion: Reduced number of LCs in OSF indicates that it does not correlate with the expression of TGF β. Areca itself may have cytotoxic/genotoxic effects on LCs.
    },
     year = {2025}
    }
    

    Copy | Download

  • TY  - JOUR
    T1  - Correlation of CD1a Positive Langerhans Cells and Transforming Growth Factor β in Oral Submucuous Fibrosis - An Immunohistochemical Study
    
    AU  - Elampavai Elangovan
    AU  - Elanangai E
    Y1  - 2025/06/23
    PY  - 2025
    N1  - https://doi.org/10.11648/j.ijcoms.20251101.15
    DO  - 10.11648/j.ijcoms.20251101.15
    T2  - International Journal of Clinical Oral and Maxillofacial Surgery
    JF  - International Journal of Clinical Oral and Maxillofacial Surgery
    JO  - International Journal of Clinical Oral and Maxillofacial Surgery
    SP  - 40
    EP  - 52
    PB  - Science Publishing Group
    SN  - 2472-1344
    UR  - https://doi.org/10.11648/j.ijcoms.20251101.15
    AB  - Background: Impaired localized epithelial immune system leads to oral cancer. Langerhans Cells (LCs) act as regulators of immune response which are regulated by Transforming Growth Factor β. But their association in a potentially malignant disorder like Oral Submucous Fibrosis (OSF), has not been researched enough. The aim of this paper was to assess the relationship between TGF β and LCs in OSF and whether TGF β can be successfully used as a therapeutic target. Context: TGF β has been a known regulator of immune response through its action on LCs which is proven in some in –vitro studies and also some of the clinical trials targeting TGF β. Aims: The aim of this paper was to assess the relationship between TGF β and LCs in OSF and whether TGF β can be successfully used as a therapeutic target. Methods & Material: Forty OSF and nine normal buccal mucosa were sectioned and subsequently stained immunohistochemically stained anti CD1a and anti (CD105) antibody respectively. Statistical Analysis Used: Student’s-t-test and One way ANOVA was applied. Results: Overall reduction of LCs in the epithelium of OSF than normal mucosa. There was no association seen between the expression of TGFβ and LCs in different stages or grades of OSF or in normal mucosa. Conclusion: Reduced number of LCs in OSF indicates that it does not correlate with the expression of TGF β. Areca itself may have cytotoxic/genotoxic effects on LCs.
    
    VL  - 11
    IS  - 1
    ER  - 

    Copy | Download

Author Information
  • Oral and Maxillofacial Pathology, Sri Venkateswara Dental College and Hospitals, Bangalore, India

  • Sri Sai Lakshmi Dental Clinics, Bangalore, India