Research Article | | Peer-Reviewed

Analysis of the Energy Supply and Demand of Solar PV Plants Installed in Rural Areas of the Far North Region of Cameroon

Received: 15 May 2025     Accepted: 30 May 2025     Published: 23 June 2025
Views:       Downloads:
Abstract

In Sub-Saharan Africa, electricity access is severely limited in rural areas, despite the abundance of sunlight. This poses a significant challenge to rural electrification initiatives, which are crucial for sustainable development. In light of this, the government of Cameroon has initiated the deployment of several solar power plants in rural regions. However, there is sometimes an imbalance between energy supply and demand, depending on the power plant's installed capacity and the size of the population. A life-cycle study is therefore being carried out in rural areas of Cameroon's Far North region with solar power plants. The study involves analyzing the balance between electricity supply and four modes of electricity consumption. These modes depend on the percentage of households that subscribe to a subscription: 100%, 50%, or 30%. The final scenario considers the International Energy Agency's (IEA) projections, wherein each Cameroonian is expected to consume 280 kWh/person/year. The findings suggest that the solar power plants installed are oversized for low-voltage domestic use, even in scenarios where 100% of households subscribe. It is only possible to achieve a balance between supply and demand from the 23rd year of operation in densely populated localities, and only if all households subscribe. If all households hold a combined domestic and non-domestic subscription, it is anticipated that demand will exceed supply between the first and seventh years of operation. The validity of this forecast is contingent upon two key variables: installed capacity and population density. Should 50% of households subscribe, it is estimated that solar power plants will encounter difficulties within the 8 to 13-year timeframe. Consequently, solar power plants will be capable of supplying less than 30% of households until the conclusion of the project.

Published in International Journal of Sustainable and Green Energy (Volume 14, Issue 2)
DOI 10.11648/j.ijsge.20251402.15
Page(s) 113-125
Creative Commons

This is an Open Access article, distributed under the terms of the Creative Commons Attribution 4.0 International License (http://creativecommons.org/licenses/by/4.0/), which permits unrestricted use, distribution and reproduction in any medium or format, provided the original work is properly cited.

Copyright

Copyright © The Author(s), 2025. Published by Science Publishing Group

Keywords

Rural Electrification, Solar Photovoltaic Power Plant, Electricity Supply, Electricity Demand, Modelling, Far North Region, Cameroon

1. Introduction
Rural electrification is defined as the percentage of the rural population with access to electricity, which promotes the socio-economic, environmental, and health development of the locality . Although sustainable development strategies should be based on rural electrification, access to electricity in rural areas is generally limited in developing countries . Where such infrastructure does exist, it requires significant financial investment and, most importantly, is unable to meet the energy needs of the population for the entire duration of the project. Developing an effective and sustainable rural electrification model for Africa, based on a balance between energy supply and demand, is therefore a matter of the utmost urgency if this type of project is to become viable. Electricity is a highly unusual commodity in that supply and demand have to be kept in balance in real time: flexibility is needed on a wide range of time scales, from seconds to years . Photovoltaic (PV) system technology, which is a solar energy source, plays an important role, present and future, in the global energy landscape .
In Cameroon, the national electricity access rate is estimated to be around 62% in 2017, 60.1% in 2016, and 58.1% in 2015 . This growth in electricity demand is expected to continue in the coming decades. Due to its favorable geographical location, Cameroon receives a good amount of solar radiation per day, with irradiation ranging from 4.85 kWh/m2/day in the southern part to 5.62 kWh/m2/day in the northern regions .
Aware of this challenge, the government of Cameroon has been working since 2017 on a major project to electrify 1,000 rural communities across the country with solar energy. The present study will analyze the energy supply and demand patterns of specific solar power plants installed in rural areas in the Far North of Cameroon. Indeed, the energy supply and demand pattern of a country or region means the situation of production, transformation, transportation and consumption of energy resources within a specified timeframe, as well as the situation of coordination of energy supply and demand and trans-regional transport, divided by the diversity of energy and region . Specifically, the aim is to conduct a comparative study of electricity supply and energy demand, first for residential use and then for combined residential and non-residential use. The different cases of electricity consumption will be considered: All households have a subscription that corresponds to 100% of the local demand; half of the households have a subscription that corresponds to 50% of the local demand; only 30% of the households have a top-up subscription.
2. Materials and Methods
2.1. Study Area
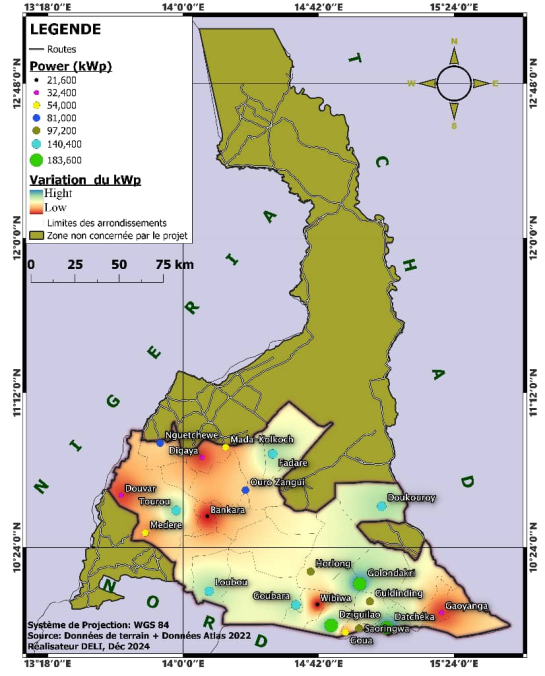
Figure 1. Map of solar installations in the far north of Cameroon from 2018 to 2023.
The Far-North region is located within the coordinates of latitude 10°34´55´´North and longitude 14°19´39´´East . It is the northern most constituent region of the Republic of Cameroon. It borders the North Region of Cameroon to the South, Chad to the East, and Nigeria to the West (Figure 1). It is one of Cameroon's most culturally diverse regions. Over 50 different ethnic groups populate the area. The region is hot and dry with seasonal waterways. The climate is tropical and Sahelian, with temperatures ranging between 28°C and 45°C, and the rainfall varies locally from 400 to 1500 mm per year . The population of the region was estimated at 4,186,844 inhabitants in 2017 , being the second most populated region in the country, and one of the most densely populated, 122.2 inhabitants/Km2. 71.2% of the population lives in rural areas .
2.2. Access to Electricity
Energy poverty can be defined as the absence of sufficient choice that allows access to adequate energy services, affordable, reliable, effective, and sustainable in environmental terms to support economic and human development .
Sub-Saharan Africa is the most deprived electricity region across the world, and hence, the energy poverty situation is more severe here compared to other regions . The Far North Region of Cameroon is the least electrified in the country, with only 37.9% of the population having access to electricity . This is further evidenced by the presence of over 3,000 unelectrified localities . Figure 2 provides a visual representation of the distribution of these unelectrified areas. A significant proportion of these localities, approximately 63%, are inhabited by fewer than 500 people. Another 25% have populations between 500 and 1,500 inhabitants, 10% fall within the range of 1,500 to 4,999 inhabitants, and a mere 2% have more than 5,000 inhabitants . Of the 47 subdivisions in the far north region, 13 have no access to electricity (see Table 1).
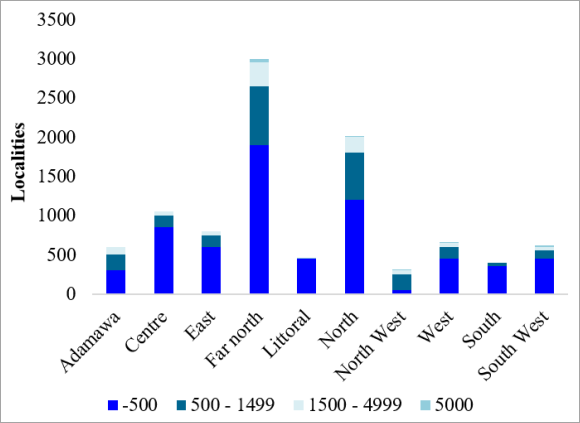
Figure 2. Number of non-electrified localities by region in Cameroon .
Access to electricity is a key issue for the development of the African continent, as stated in Sustainable Development Goal 7, which aims to guarantee "access to affordable, reliable, sustainable and modern energy for all" by 2030.
During phases 1 and 2 (from 2018 to 2023), the Government of Cameroon installed solar photovoltaic power plants in 350 village localities across the country . 21 communities in the Far North region have benefited (Figure 1).
Table 1. Electrical energy access situation per division in the Far North region of Cameroon.

Division

Number of districts

Number of non-electrified Districts

Diamaré

09

01

Logone et Chari

10

07

Mayo Danay

11

04

Mayo Kani

07

01

Mayo Sava

03

0

Mayo Tsanaga

08

0

2.3. Energy Demand Modeling
The analysis of actual consumption in electrified localities is the primary method by which the demand for electricity in rural areas of Cameroon is addressed. The findings of this study demonstrate that rural agencies can be categorized into five agroecological zones, as outlined in Table 2.
Table 2. The different agroecological zones in Cameroon .

Zone

Agroecological zone

Région

Zone 1

Sudano-Sahelian zone

North, Far North

Zone 2

Guinean High Savannah zone

Adamawa

Zone 3

Western High Plateau zone

North-West, West

Zone 4

Monomodal Rainforest zone

Littoral, South-West

Zone 5

Bimodal Rainforest zone

South, East, Centre

The rural electrification market in Cameroon is segmented into three primary components, contingent upon the tariff signal applied to diverse subscriber profiles. :
Low voltage (LV) domestic demand:
1. consumption < 110 kWh/month;
2. 110 kWh/month < consumption < 400 kWh/month;
3. consumption > 400 kWh/month).
LV non-domestic demand (professional and social active ties, including public lighting):
1. consumption < 110 kWh/month;
2. 110 kWh/month < consumption < 400 kWh/month;
3. consumption > 400 kWh/month).
High Voltage demand (HV):
1. These demands are typically made by agro-industrial units, which are naturally located in rural areas close to raw materials such as cotton and wood.
2. The presence of such industrial units in rural areas is random and difficult to model. However, disregarding these factors would result in a substantial underestimation of rural consumption.
3. Despite the fact that this solution is not entirely satisfactory, in the absence of a geo-referenced database of the main agro-industries, a statistical approach is used.
A study conducted in 2014 enabled the calculation of the mean monthly consumption of each subscriber category . As illustrated in Table 3, the consumption data is summarized.
Table 3. Monthly consumption by subscriber class in rural areas in 2014.

Zone

Average monthly non-residential consumption (kWh)

Average monthly non-residential consumption (kWh)

Average voltage consumption (kWh)

Zone 1

69

242

9

Zone 2

85

263

4.25

Zone 3

54

170

2.7

Zone 4

68

244

3.4

Zone 5

61

252

3

2.4. Forecasting Analysis of Electricity Demand in Rural Areas
The study of electricity demand in rural areas is of particular interest, and it is important to note that the growth in demand is primarily attributable to four key phenomena : The population growth rate in rural areas is 1.82%; Secondly, an increase in the unit consumption of each category of customer is to be observed; Thirdly, the distinct evolutionary trajectories of the various customer categories must be considered and fourthly, the increase in the electricity penetration rate.
Growth in unit consumption, changes in subscriber categories, and electricity penetration evolve at a rate of 2.39%, 1.96%, 1.52%, and 1.09% per 5 years following the system's installation.
A model of electricity demand growth has been constructed, considering the specified parameters. The model is presented in Table 4 and shows projected demand growth in 5-year stages.
Table 4. Demand growth modelling for a rural location is presented.

[Y-Y+5]

[Y+5-Y+10]

[Y+10- Y+15]

[Y+15-Y+20]

Moyenne

Demographic growth

1.82%

1.82%

1.82%

1.82%

1.82%

Growth in unit consumption

2.39%

1.96%

1.52%

1.09%

1.74%

Change in customer categories

2.39%

1.96%

1.52%

1.09%

1.74%

Growth in electricity penetration

2.39%

1.96%

1.52%

1.09%

1.74%

Annual growth of low voltage (LV) and medium voltage (MV)

9%

7.7%

6.39%

5.09%

7.04%

2.5. The International Energy Agency's (IEA) Model of Electricity Demand
According to the International Energy Agency (IEA), the average electricity consumption in Cameroon in 2014 was 280 kWh per capita per year . This electrical energy consumption is calculated concerning the production of power plants and electrocalogen power plants, except transmission and distribution, transmission losses, and the energy use of power plants and electrocalogen power plants . In this study, the final value is considered constant for subsequent years.
3. Results
In this section, an analysis will be conducted of the energy supply and demand of seven localities located in rural areas of the Far North region, with different installed capacities (see Table 5).
The analysis of energy demand will be conducted utilising the two models previously delineated. Depending on whether the electricity demand is domestic or non-domestic, the following scenarios will be considered:
1. In the first scenario, all households have taken out a subscription, corresponding to 100% of local demand.
2. In the second scenario, 50% of households have taken out a subscription, corresponding to 50% of the locality's demand.
3. In the third scenario, only 30% of households have taken out a top-up subscription.
The following table provides a comprehensive overview of the designated study area.
Table 5. Characteristics of the study area.

Site name

Division

Sub-division

Power (kWp)

Number of households

Bankara

Diamare

Gazawa

21.6

30

Datcheka

Mayo-Danay

Datcheka

183.6

430

Digaya

Mayo Sava

Tokombere

32.4

60

Goua

Mayo-Danay

Tchatibali

54.0

110

Goubara

Mayo Kani

Kaele

140.4

330

Horlong

Mayo-Kani

Mouvoudaye

97.2

220

Nguetchewe

Mayo-Tsanaga

Mayo maskota

81.0

150

3.1. Low-voltage Domestic Demand
The following discussion will first consider the premise that household electricity demand is low-voltage domestic demand.
3.1.1. The Bankara Solar Power Plant (21.6 kWp)
The deliverable energy is estimated to be approximately 190 MWh/year over the lifetime of the project. It is evident from Figure 3 that the supply of electricity will invariably exceed its demand, irrespective of the type of scenario that is considered.
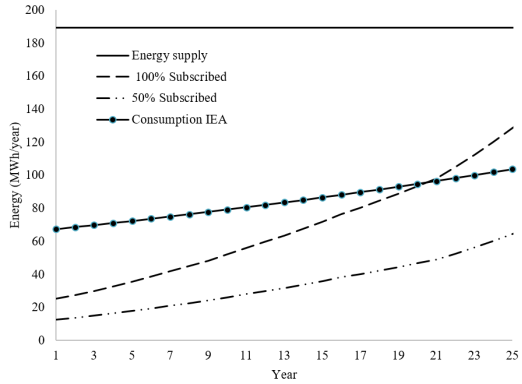
Figure 3. Trend in the total energy produced and consumed for low-voltage domestic use at the Bankara solar power plant.
As demonstrated in Figure 4, the annual electricity supply per inhabitant exhibits a decline over time, while demand experiences an increase. In the year in which the plant was inaugurated, the yearly electricity demand per inhabitant was 105 kWh, 52.5 kWh, and 281 kWh/inhabitant/year when the population subscribed to 100%, 50%, or the IEA standard, respectively. This is in comparison with a much higher electricity supply of 791.6 kWh/inhabitant/year. Following 20 years of operation, the annual electricity supply per inhabitant is projected to reach 560 kWh, in comparison to an electricity demand of 280 kWh when all households have subscribed, as outlined in the IEA scenario, and 138 kWh when half of the households have subscribed.
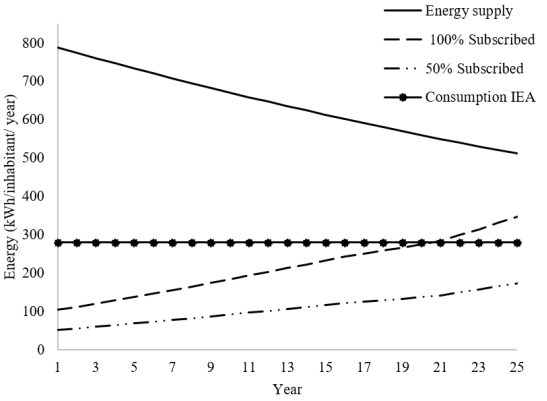
Figure 4. Trend in energy produced and consumed per inhabitant for low-voltage domestic use at the Bankara solar power plant.
In the 20th year, the International Energy Agency (IEA) asserts that the scenario of 100% of households being electrified will equal consumption, which is 281 kWh/inhabitant/year.
This results in a significant imbalance between electricity supply and demand for this particular power plant type, with the solar power plant being oversized about demand.
3.1.2. The Dikaya Solar Power Plant (32.4 kWp)
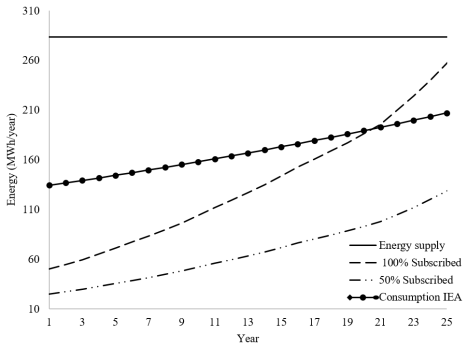
Figure 5. Trend in total energy produced and consumed for low-voltage domestic use at the Dikaya solar power plant.
The solar power plant in question has an output of 284 MWh/year. Electricity supply invariably exceeds demand, irrespective of the considered scenario, as demonstrated in the accompanying Figure 5.
The annual electricity supply per inhabitant is predicted to decrease from 591.6 kWh to 420 kWh/inhabitant/year in year 20, while annual consumption per inhabitant is predicted to increase from 105 to 280 kWh when all households have a subscription (Figure 6). This configuration also demonstrates that electricity supply far exceeds electricity demand; the Bankara solar power plant is therefore oversized for low-voltage domestic services.
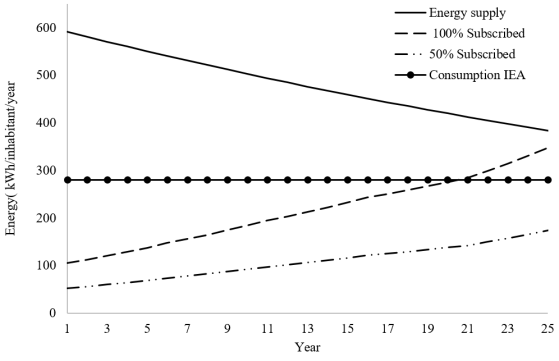
Figure 6. Trends in energy produced and consumed per inhabitant for low-voltage domestic use at the Dikaya solar power plant.
3.1.3. Goua Solar Power Plant (54 kWp)
The Goua Solar Power Plant has been calculated to deliver 473 MWh/year over the lifetime of the project (Figure 7).
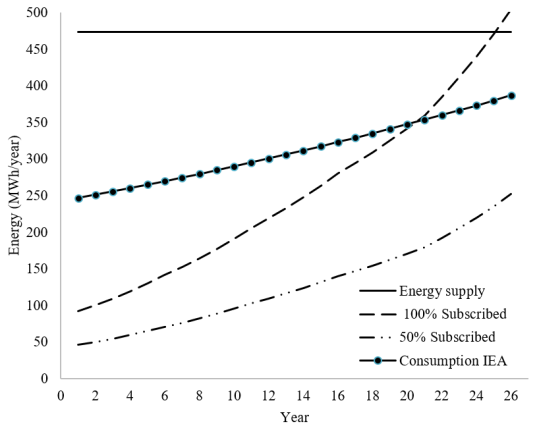
Figure 7. Trend in total energy produced and consumed for low-voltage domestic use at the Goua solar power plant.
Although the electricity supply is significantly greater than demand at the commencement of the project, the discrepancy is substantially reduced by the conclusion of the project for the IEA's consumption and 100% subscription scenarios. It is projected that equilibrium will be achieved in year 25, on the condition that all households take out a subscription, with a consumption of 347 kWh per capita per annum (Figure 8). The solar power plant is therefore well-sized for low-voltage domestic consumption in this scenario.
Figure 8. Trend in energy produced and consumed per inhabitant for domestic low-voltage use at the Goua solar power plant.
3.1.4. Nguetchewe Power Plant (81 kWp)
The Nguetchewe solar power plant has been calculated to deliver 709.6 MWh/year over the lifetime of the project (Figure 9).
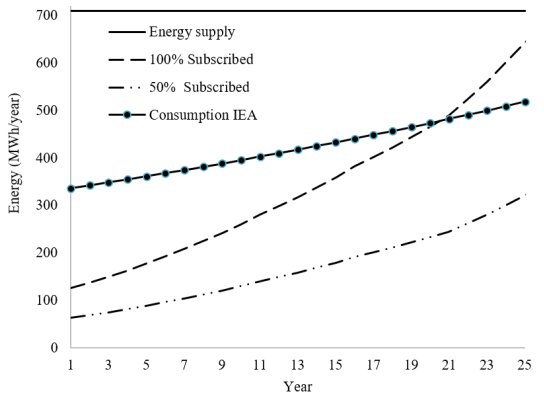
Figure 9. Trend in the total energy produced and consumed for low-voltage domestic use at the Nguetchewe solar power plant.
It is evident that the electricity supply significantly exceeds all the consumption modes presented. At the age of 20, the annual electricity supply per inhabitant is 420 kWh, whereas the individual consumption is 280 kWh (Figure 10).
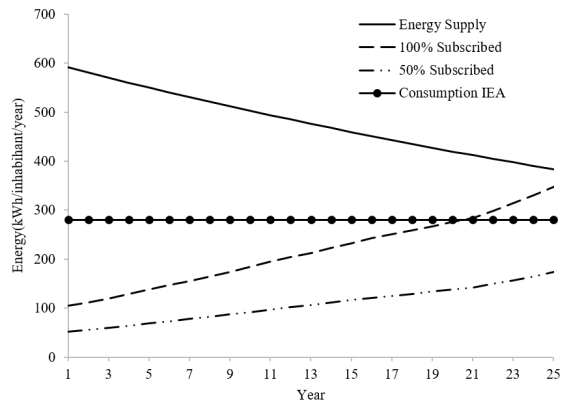
Figure 10. Trends in energy produced and consumed per capita for low-voltage domestic use at the Nguetchewe solar power plant.
The Nguetchewe solar power plant is therefore oversized for low-voltage domestic consumption.
3.1.5. Horlong Power Plant
The Nguetchewe Solar Power Plant is projected to generate 851.5 MWh per year throughout its operational lifespan (Figure 11).
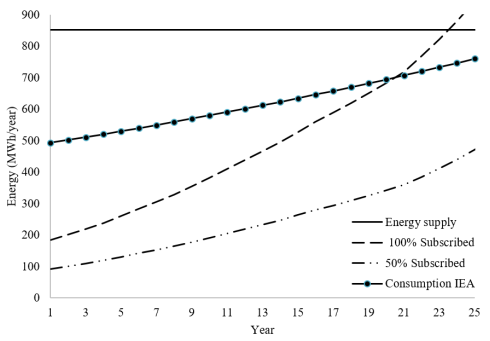
Figure 11. Trend in total energy produced and consumed for low-voltage domestic use at the Horlong solar power plant.
In the initial years of the project, the demand for electricity consistently outstrips supply, irrespective of the subscription type. However, as the project progresses, this disparity gradually diminishes. By the 20th year, the annual electricity consumption per capita is recorded at 280 kWh, assuming that all households have opted for a subscription, or if consumption is measured according to the IEA's standards. Figure 12 stands in contrast to the supply of 343 kWh per person per year. It is projected that, from the 24th year of the project, the solar power plant will no longer be capable of meeting electricity demand if all households have subscribed.
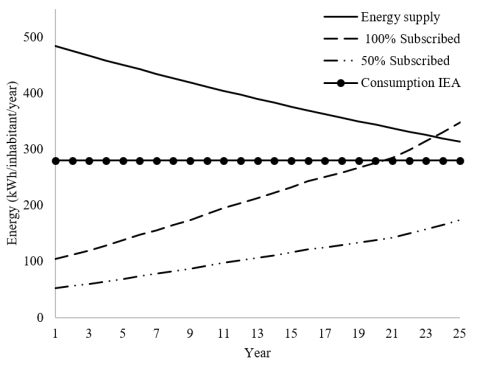
Figure 12. Trend in energy produced and consumed per inhabitant for low-voltage domestic use at the Horlong solar power plant.
The Horlong solar power plant is therefore well-sized if all households take out a subscription or consume around 280 kWh/inhabitant/year.
3.1.6. Goubara Solar Power Plant
The annual production of the Goubara Solar Power Plant is 1230 MWh (Figure 13).
In the initial years of the project, the electricity demand consistently outstrips supply, irrespective of the subscription type. However, as the project progresses, this disparity gradually diminishes. By the 20th year, the annual electricity consumption per capita is recorded at 280 kWh, assuming all households have opted for a subscription or that consumption is measured by the IEA.
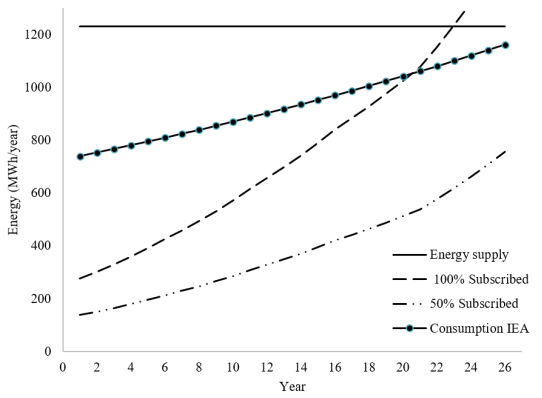
Figure 13. Trend in total energy produced and consumed for low-voltage domestic use by the Goubara solar power plant.
Figure 14 stands in contrast to the supply of 325 kWh per person per year. It is projected that, from the 23rd year of the project, the solar power plant will no longer be capable of meeting electricity demand if all households subscribe.
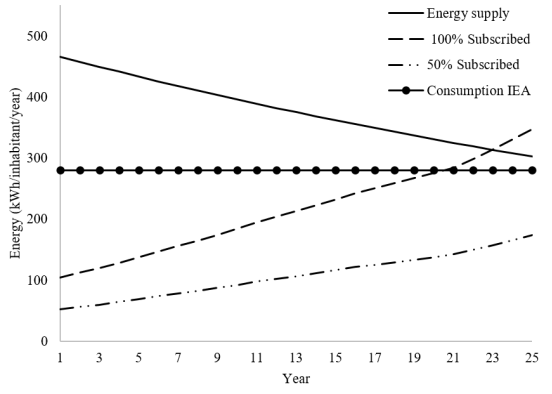
Figure 14. Trend in energy produced and consumed per inhabitant for low-voltage domestic use at the Goubara solar power plant.
The Goubara solar power plant has been designed with a 20-year lifespan in mind, assuming that all households subscribe or consume approximately 280 kWh/inhabitant/year.
3.1.7. Datcheka Solar Power Plant
The plant's annual capacity is 1608 MWh (Figure 15).
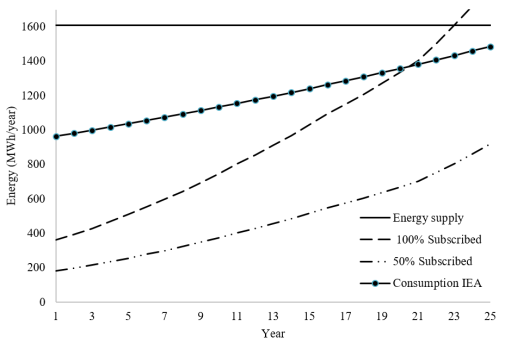
Figure 15. Evolution of total energy produced and consumed for low-voltage domestic use at the Datcheka solar power plant.
As demonstrated in Figure 16, during the initial years of the project, the electricity supply consistently exceeds demand, irrespective of the subscription type. This disparity subsequently diminishes as the project progresses. By the 20th year, the average electricity consumption per capita is 280 kWh/year, assuming all households have subscribed to a service or based on IEA consumption data, compared with a supply of 332 kWh/person/year. It is projected that, from the 23rd year of the project, the solar power plant will no longer be capable of meeting electricity demand if all households subscribe.
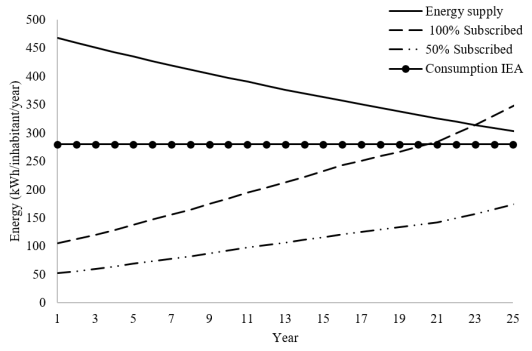
Figure 16. Evolution of energy produced and consumed per inhabitant for low-voltage domestic use at the Datcheka solar power plant.
The Datcheka solar power plant has been designed with a 20-year lifespan in mind, assuming that all households subscribe or consume approximately 280 kWh/inhabitant/year.
3.2. Domestic and Non-domestic Low-voltage Demand
It is evident that, of all the power plants presented, low-voltage electricity demand invariably falls short of supply. The subsequent analysis will examine the behavior of these plants when non-domestic consumption is added to the domestic demand studied above.
3.2.1. Bankara Solar Power Plant
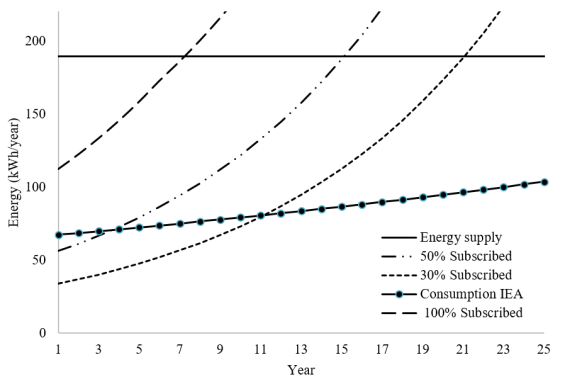
Figure 17. Trend in total energy produced and consumed for domestic and non-domestic low-voltage use at the Bankara solar power plant.
As demonstrated in Figure 17, the solar power plant is projected to encounter challenges in meeting demand after a few years of operation, with a subscription rate exceeding 30% in households. From the 8th year onwards, the solar system is predicted to be incapable of meeting the full demand for the 100% subscription scenario. It is evident that, from the 15th year onwards, the electricity demand will exceed the available supply, even when the subscription rate is set at 50%. The solar power plant has thus been appropriately sized for a demand where 30% of households have taken out a subscription.
3.2.2. Dikaya Solar Power Plant
As illustrated in Figure 18, beginning from the fifth and sixth year of operation, the solar power plant experiences challenges in meeting demand in the 100% and 50% household subscription scenarios, respectively. It is projected that a balance between supply and demand will be achieved in year 22, assuming that 30% of households subscribe. The Dikaya power plant is therefore well-sized to meet the domestic and non-domestic energy needs of around 30% of households in the locality.
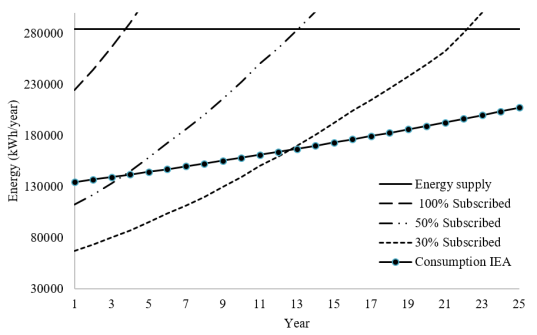
Figure 18. Trend in total energy produced and consumed for domestic and non-domestic low-voltage use at the Dikaya solar power plant.
3.2.3. Goua Solar Power Plant
As demonstrated in Figure 19, from years 3 and 12 onwards, demand will exceed supply if 100% of households and 50% of households, respectively, subscribe. Consequently, the solar power plant will encounter operational challenges. It is only in the scenario where 30% of households have taken out a subscription that the plant is shown to be operating well, with equilibrium being reached in year 21. At the 20-year mark, the supply and demand figures stand at 382 and 367 kWh/capita/person, respectively.
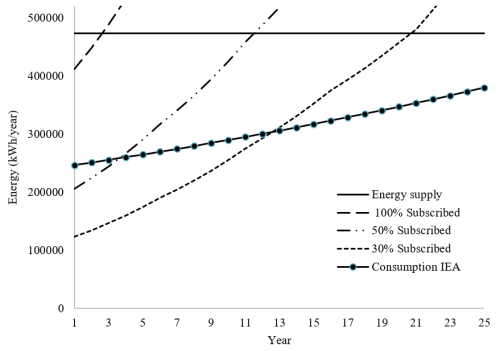
Figure 19. Trend in total energy produced and consumed for domestic and non-domestic low-voltage use at the Goua solar power plant.
3.2.4. Nguetchewe Solar Power Plant
As demonstrated in Figure 20, energy demand is projected to exceed supply after 4 and 13 years in the 100% and 50% subscription scenarios, respectively. The 30% subscription scenario is projected to reach equilibrium in the 22nd year, coinciding with the commencement of operations at the Nguetchewe solar power plant.
Figure 20. Trend in total energy produced and consumed for domestic and non-domestic low-voltage use at the Nguetchewe solar power plant.
3.2.5. Horlong Solar Power Plant
As illustrated in Figure 21, the plant experiences challenges from the second year of operation onwards, as all households have subscribed. This difficulty is also observed after 10 and 19 years of operation, when half and 30% of households, respectively, have subscribed. It is therefore concluded that the Horlong power station will operate at maximum efficiency if each inhabitant consumes 280 kWh/year.
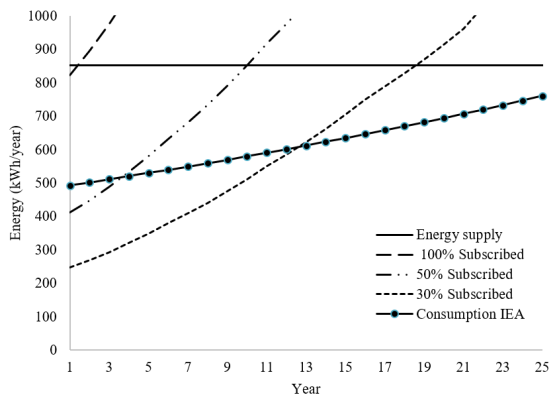
Figure 21. Trend in total energy produced and consumed for domestic and non-domestic low-voltage use at the Horlong solar power plant.
3.2.6. Goubara and Datcheka Solar Power Stations
As demonstrated in Figure 22 and Figure 23, if all households subscribe to both domestic and non-domestic services, demand will exceed supply from the first year onwards. It is important to note that the aforementioned observation will be made in years 10 and 18 for the 50% and 30% subscription scenarios, respectively. Notably, the sole instance of consumption by the IEA scenario is that which corresponds to the Goubara solar power plant functioning optimally.
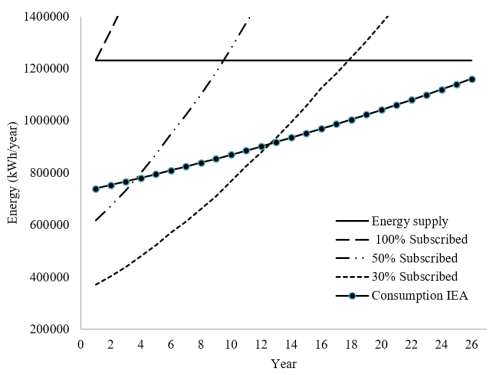
Figure 22. Trend in total energy produced and consumed for domestic and non-domestic low-voltage use at the Goubara solar power plant.
Figure 23. Total energy produced and consumed for domestic and non-domestic low-voltage use by the Datcheka solar power plant.
4. Conclusion
The objective of the present article was to undertake a comparative study of the electricity supply and demand for solar photovoltaic power plants installed in rural areas in the Far North region of Cameroon. The electrical demand is first considered for low-voltage domestic use and subsequent domestic and non-domestic use. This analysis demonstrates that:
1. The majority of solar power plants are oversized when the energy demand is solely for low-voltage domestic use;
2. Solar power plants are undersized for subscriptions involving more than 30% of households when the energy demand is for combined domestic and non-domestic low-voltage use.
To address the imbalance between energy supply and demand for these solar power plants, the following recommendations are proposed for consideration by the relevant decision-makers: The size of the solar system should be determined by energy demand. The solar power plant should be designed to be flexible, meaning that the electricity supply can adapt to energy demand, particularly at the project's inception when the gap is significant, such as in low-voltage domestic use. Furthermore, it is imperative to raise public awareness about the potential consequences of excessive non-domestic energy consumption, emphasizing the risk of malfunctioning in solar power plants.
Future work will focus on managing the flow of energy from solar power plants in rural areas, depending on whether they are oversized or undersized. The feasibility of integrating surplus solar energy into the existing electricity grid infrastructure will be thoroughly examined.
Abbreviations

IEA

International Energy Agency

PV

Photovoltaic

LV

Low Voltage

HV

High Voltage

Acknowledgments
The authors of this manuscript are thankful to the Cameroon Rural Electrification Agency (REA) for providing data which permit to carry out this article.
Author Contributions
Deli Goron: Conceptualization, Methodology, Supervision, Writing – original draft, Writing – review & editing, Project administration, Formal Analysis
Gustave Assoualaye: Investigation, Data curation, Validation
Mahamat Hassane Babikir: Resources, Software, Visualization, Funding acquisition
Data Availability Statement
The data is available from the corresponding author upon reasonable request.
Funding
This work is not supported by any external funding.
Conflicts of Interest
The authors declare no conflicts of interest.
References
[1] Trotter, P. A., Rural electrification, electrification inequality and democratic institutions in sub-Saharan Africa, Energy for Sustainable Development, 2016, 34, 111-129.
[2] Ngowi, J. M., Bångens, L., Ahlgren, E. O., Benefits and challenges to productive use of off-grid rural electrification: The case of mini-hydropower in Bulongwa-Tanzania, Energy for Sustainable Development, 2019, 53, 97-103.
[3] Vernet, A., Khayesi, J. N., George, V., Bahaj, A. S., How does energy matter? Rural electrification, entrepreneurship, and community development in Kenya, Energy Policy, 2019, 126, 88-98.
[4] Sarker, S. A., Wang, S., Adnan, K. M., Anser, M. K., Ayoub, Z., Ho, T. H., et al., Economic viability and socio-environmental impacts of solar home systems for off-grid rural electrification in Bangladesh, Energies, 2020, 13(3), 679.
[5] Akbas, B., Kocaman, A. S, Nock, D., Trotter, P. A., Rural electrification: An overview of optimization methods, Renewable and Sustainable Energy Reviews, 2022, 156, 111935.
[6] Lo, K., Kibalya, B., Electric cooperatives and the political economy of rural electrification in Africa: Insights from Uganda, The Electricity Journal, 2023, 36(1), 107238.
[7] Grunewald, P., Diakonova, M., Flexibility, dynamism and diversity in energy supply and demand: A critical review, Energy Research & Social Science, 2018, 38, 58-66.
[8] Alves dos Santos, S. A., Torres, J. P. N, Fernandes, C. A. F., and Marques Lameirinhas, R. A., The impact of aging of solar cells on the performance of photovoltaic panels, Energy Conversion and Management, 2021, vol. 10, p. 100082.
[9] Elfaqih, A. K., Elbaz, A., Bashiri, M. A., A Case Study on the Performance Degradation of a Photovoltaic System Module in Tripoli, Libya, International Journal of Renewable Energy Research (IJRER), 2025, 15(1), 56-63.
[10] Eneo the energy of Cameroon, Rapport annuel 2018, Available from:
[11] Dieudonné, N. T., Armel, T. K. F., Vidal, A. K. C., Rene, T., Prediction of electrical energy consumption in Cameroon through econometric models, Electric Power Systems Research, 2022, 210, 108102.
[12] FUMTCHUM, G., A. M. E. A AKATA, A. M. E. A., MOUANGUE, R., DAKYO, B., Predicting the Efficiency of Solar Photovoltaic Energy Injection in a Localized Subtropical Grid by Modelling Actual Generation Trend Curves: Case Study of Douala, International Journal of Renewable Energy Research (IJRER), 2023, 13(4), 1614-1620.
[13] Liu, J., Niu, D., Song, X., The energy supply and demand pattern of China: A review of evolution and sustainable development, Renewable and Sustainable Energy Reviews, 2013, 25, 220-228.
[14] Seignobos, C., Iyébi-Mandjek, « Atlas de la province de l’Extrême Nord », Edition de l’IRD, Institut de Recherche pour le Développement, 2005.
[15] Institut National de la Statistique (INS), Annuaire statistique 2018 de la region extrême-nord, Rapport, 2019.
[16] PNDP/EN, Programme National de Développement Participatif/ Extrême-Nord, rapport, Cameroon, 2012.
[17] Chevalier, J. M., Ouédraogo, N. S., Energy Poverty and Economic Development, Palgrave Macmillan Books, Jean-Marie Chevalier (ed), The New Energy Crisis, 2009, chapter 4, pp. 115- 144.
[18] H. Wang, M. W. Zafar, S. Abbas, “An assessment of energy poverty in sub-Saharan Africa: the role of financial inclusion and education”, Econ Change Restruct 56, 4689–4711, 2023.
[19] SRADDT, « Schéma Régional d’Aménagement et de Développement Durable du Territoire de l’Extrême Nord du Cameroun », Ministère de l’économie, de la planification et de l’aménagement du territoire, rapport, 2019.
[20] PDER, Plan Directeur d’Electrification Rurale du Cameroun, Rapport final, rapport, 2016.
[21] Rural Electrification Agency of Cameroon, «Mission de rétrocession des centrales solaires photovoltaïques de la phase 1», 166 localités, Rapport de synthèse, 2022.
[22] Rural Electrification Agency of Cameroon, «Mission de rétrocession des centrales solaires photovoltaïques de la phase 2», 184 localités, Rapport de synthèse, 2023.
[23] Augustin, D., Pascal, I. M., Honoré, M. E., Cesar, M. B., “Impact of extreme rainfall variability and changes on ground traffic in Cameroon”, Theoretical and Applied Climatology, 155(4), 3175-3185, 2024.
[24] ARSEL, Agence de Régulation du Secteur de Electricité au Cameroun, Décision N°_0096_/ARSEL/DG/DCEC/SDCT DU_28 mai 2012_ fixant les tarifs de vente hors taxes d’électricité applicables par la societé Eneo Cameroon l’année 2012.
[25] AIE Agence internationale de l'énergie, Statistiques sur l'énergie et balances des pays non membres de l'OCDE et Statistiques sur l'énergie des pays membres de l'OCDE, available from:
Cite This Article
  • APA Style

    Goron, D., Assoualaye, G., Babikir, M. H. (2025). Analysis of the Energy Supply and Demand of Solar PV Plants Installed in Rural Areas of the Far North Region of Cameroon. International Journal of Sustainable and Green Energy, 14(2), 113-125. https://doi.org/10.11648/j.ijsge.20251402.15

    Copy | Download

    ACS Style

    Goron, D.; Assoualaye, G.; Babikir, M. H. Analysis of the Energy Supply and Demand of Solar PV Plants Installed in Rural Areas of the Far North Region of Cameroon. Int. J. Sustain. Green Energy 2025, 14(2), 113-125. doi: 10.11648/j.ijsge.20251402.15

    Copy | Download

    AMA Style

    Goron D, Assoualaye G, Babikir MH. Analysis of the Energy Supply and Demand of Solar PV Plants Installed in Rural Areas of the Far North Region of Cameroon. Int J Sustain Green Energy. 2025;14(2):113-125. doi: 10.11648/j.ijsge.20251402.15

    Copy | Download

  • @article{10.11648/j.ijsge.20251402.15,
      author = {Deli Goron and Gustave Assoualaye and Mahamat Hassane Babikir},
      title = {Analysis of the Energy Supply and Demand of Solar PV Plants Installed in Rural Areas of the Far North Region of Cameroon
    },
      journal = {International Journal of Sustainable and Green Energy},
      volume = {14},
      number = {2},
      pages = {113-125},
      doi = {10.11648/j.ijsge.20251402.15},
      url = {https://doi.org/10.11648/j.ijsge.20251402.15},
      eprint = {https://article.sciencepublishinggroup.com/pdf/10.11648.j.ijsge.20251402.15},
      abstract = {In Sub-Saharan Africa, electricity access is severely limited in rural areas, despite the abundance of sunlight. This poses a significant challenge to rural electrification initiatives, which are crucial for sustainable development. In light of this, the government of Cameroon has initiated the deployment of several solar power plants in rural regions. However, there is sometimes an imbalance between energy supply and demand, depending on the power plant's installed capacity and the size of the population. A life-cycle study is therefore being carried out in rural areas of Cameroon's Far North region with solar power plants. The study involves analyzing the balance between electricity supply and four modes of electricity consumption. These modes depend on the percentage of households that subscribe to a subscription: 100%, 50%, or 30%. The final scenario considers the International Energy Agency's (IEA) projections, wherein each Cameroonian is expected to consume 280 kWh/person/year. The findings suggest that the solar power plants installed are oversized for low-voltage domestic use, even in scenarios where 100% of households subscribe. It is only possible to achieve a balance between supply and demand from the 23rd year of operation in densely populated localities, and only if all households subscribe. If all households hold a combined domestic and non-domestic subscription, it is anticipated that demand will exceed supply between the first and seventh years of operation. The validity of this forecast is contingent upon two key variables: installed capacity and population density. Should 50% of households subscribe, it is estimated that solar power plants will encounter difficulties within the 8 to 13-year timeframe. Consequently, solar power plants will be capable of supplying less than 30% of households until the conclusion of the project.
    },
     year = {2025}
    }
    

    Copy | Download

  • TY  - JOUR
    T1  - Analysis of the Energy Supply and Demand of Solar PV Plants Installed in Rural Areas of the Far North Region of Cameroon
    
    AU  - Deli Goron
    AU  - Gustave Assoualaye
    AU  - Mahamat Hassane Babikir
    Y1  - 2025/06/23
    PY  - 2025
    N1  - https://doi.org/10.11648/j.ijsge.20251402.15
    DO  - 10.11648/j.ijsge.20251402.15
    T2  - International Journal of Sustainable and Green Energy
    JF  - International Journal of Sustainable and Green Energy
    JO  - International Journal of Sustainable and Green Energy
    SP  - 113
    EP  - 125
    PB  - Science Publishing Group
    SN  - 2575-1549
    UR  - https://doi.org/10.11648/j.ijsge.20251402.15
    AB  - In Sub-Saharan Africa, electricity access is severely limited in rural areas, despite the abundance of sunlight. This poses a significant challenge to rural electrification initiatives, which are crucial for sustainable development. In light of this, the government of Cameroon has initiated the deployment of several solar power plants in rural regions. However, there is sometimes an imbalance between energy supply and demand, depending on the power plant's installed capacity and the size of the population. A life-cycle study is therefore being carried out in rural areas of Cameroon's Far North region with solar power plants. The study involves analyzing the balance between electricity supply and four modes of electricity consumption. These modes depend on the percentage of households that subscribe to a subscription: 100%, 50%, or 30%. The final scenario considers the International Energy Agency's (IEA) projections, wherein each Cameroonian is expected to consume 280 kWh/person/year. The findings suggest that the solar power plants installed are oversized for low-voltage domestic use, even in scenarios where 100% of households subscribe. It is only possible to achieve a balance between supply and demand from the 23rd year of operation in densely populated localities, and only if all households subscribe. If all households hold a combined domestic and non-domestic subscription, it is anticipated that demand will exceed supply between the first and seventh years of operation. The validity of this forecast is contingent upon two key variables: installed capacity and population density. Should 50% of households subscribe, it is estimated that solar power plants will encounter difficulties within the 8 to 13-year timeframe. Consequently, solar power plants will be capable of supplying less than 30% of households until the conclusion of the project.
    
    VL  - 14
    IS  - 2
    ER  - 

    Copy | Download

Author Information
  • Department of Renewable Energy, National Advanced School of Engineering, University of Maroua, Maroua, Cameroon

    Biography: Deli Goron is a lecturer at the Department of Renewable Energy at the Ecole Nationale Supérieure Polytechnique, University of Maroua. He obtained his PhD in Physics, Energy and Environment option from the University of Yaoundé1 in 2016. His research areas are photovoltaic and thermal solar energy, hydropower, etc.

    Research Fields: Photovoltaic solar energy, Photovoltaic module shading modelling, Therman solar energy, Flat plate collectors, hydropower, Energy Demand and Supply Study.

  • Department of Renewable Energy, National Advanced School of Engineering, University of Maroua, Maroua, Cameroon

  • Department of Physics, University of N’djamena, N’djamena, Chad